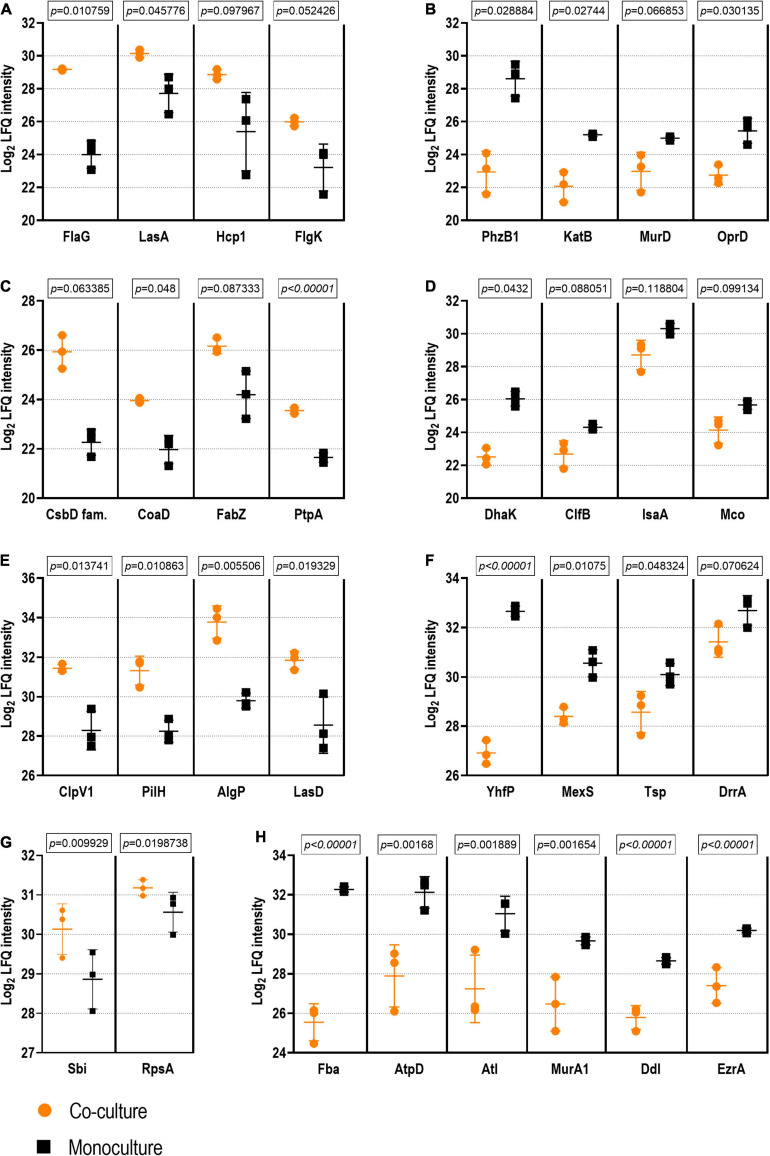
FIGURE 5.
Examples of proteins with statistical differences of abundance in co-culture vs. monoculture. The exoproteome is represented by examples of Pseudomonas aeruginosa proteins with higher (A) and lower abundance (B) as well as by examples of Staphylococcus aureus proteins with higher (C) and lower abundance (D) in co-culture vs. monoculture. The surfaceome is represented by examples of P. aeruginosa proteins with higher (E) and lower abundance (F) as well as by examples of S. aureus proteins with higher (G) and lower abundance (H) in co-culture vs. in monoculture. Student’s t-test q-Values (permutation-based false discovery rate) are presented for each comparison (see Supplementary Tables 6–9 for the complete dataset).

