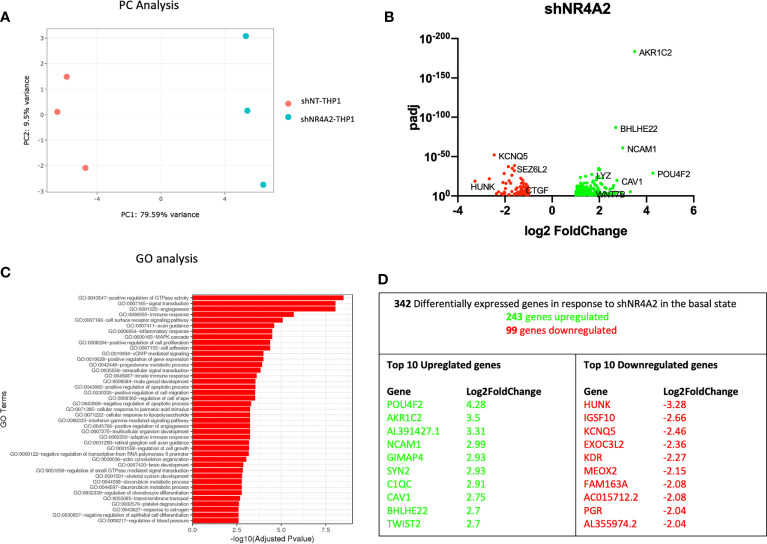
Figure 1.
Knockdown of NR4A2 has a distinct transcriptional profile in the basal state. Principal component analysis (PCA) plot of transduced cells based on RNA-seq data between shNT and shNR4A2 cells (A). Volcano plot of significant DEGs (p<0.05) upregulated (log2fc>/=1) (green) or downregulated (log2fc</=-1) (red) by knockdown of NR4A2 in THP-1 cells based on RNA-seq data (B). Top gene ontology (GO) terms associated with knockdown of NR4A2 in THP-1 cells based on RNA-seq data (C). Summary table of significant DEGs upregulated (green) and downregulated (red) by knockdown of NR4A2 in THP-1 cells based on RNA-seq data (D).

