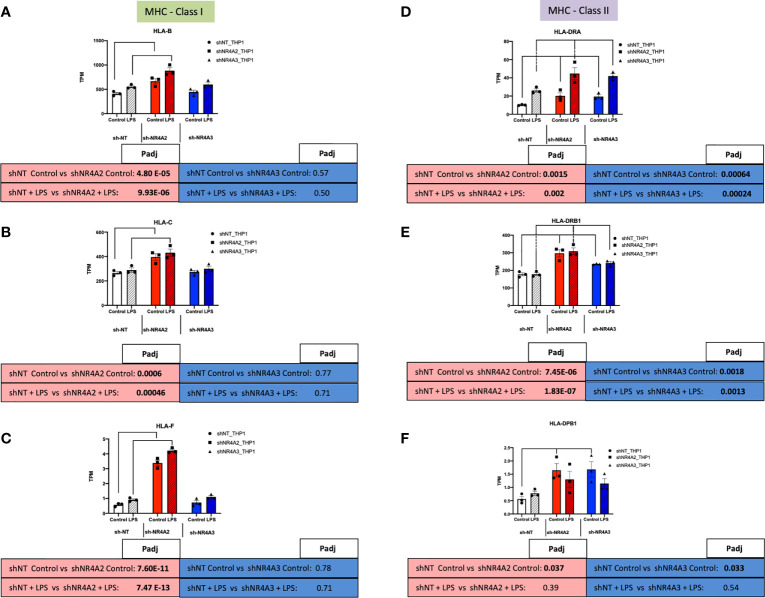
Figure 10.
Knockdown of NR4A2 alters MHC Class1 gene expression. RAW TPM values (mean +/- SEM) extracted from RNA-seq for genes associated with MHC-Class I (green rectangles) and MHC-Class II (purple rectangles). Data shown for HLA-B (A) HLA-C (B) HLA-F (C) HLA-DRA (D) HLA-DRB1 (E) and HLA-DPB1 (F) in shNT-THP1 cells, shNR4A2-THP1 cells and shNR4A3-THP1 cells in the control (unstimulated state) and following LPS treatment (2.5μg/ml for 2hrs). N=3 independent experiments. Adjusted p-values (Padj) for specific comparisons are contained in the tables below the TPM data. Statistically significant Padj are denoted in bold font. Comparisons between shNR4A2 cells and control are denoted in the red boxes, comparisons between the shNR4A3 cells and control are denoted in the blue boxes. Statistically significant comparisons are further signposted using bars on the TPM graphs.

