Figure 2.
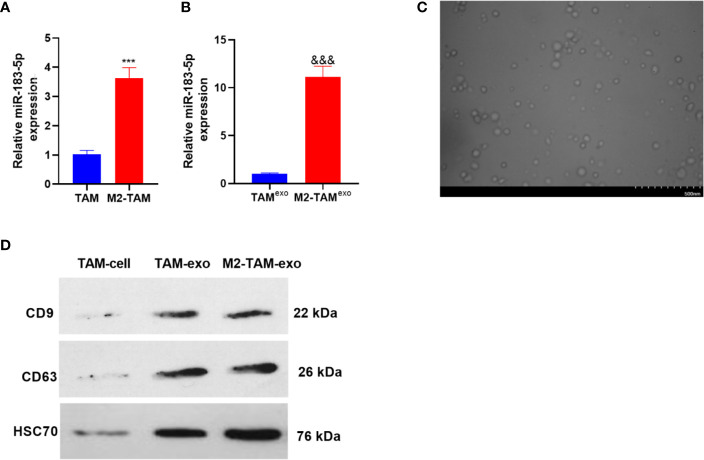
MiR-183-5p was enriched in M2-TAM-Exo. The miR-183-5p expression in M2-TAM was detected. (A, B) The profiles of miR-183-5p in TAM, M2-TAM and TAM-Exp/M2-TAM-Exo were compared by qRT-PCR. (C) TAM and M2-TAM-Exo were identified by Electron microscopy. (D) WB was implemented to verify the exosome surface markers CD9, CD63 and HSC70. ***P < 0.001(vs. The TAM group), &&& P < 0.001(vs. the TAM exo group). N=3.

