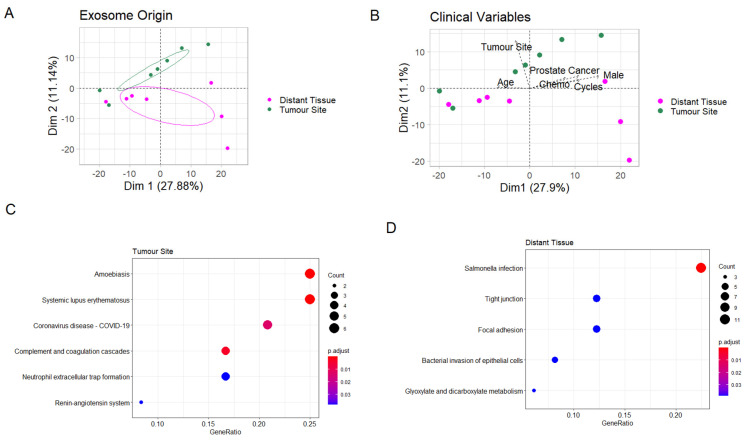
Figure 3.
Comparison of exosomes from the tumour site and distant tissue. (A) Principal component analysis (PCA). Ellipses represent 95% confidence intervals. (B) PCA biplot. The arrows represent clinical parameters, their direction shows how they correlate with the two PCA axes, and their length increases with the correlation value. (C,D) Enrichment plots showing enriched pathways among proteins significantly higher at the tumour site and in distant tissue, respectively.

