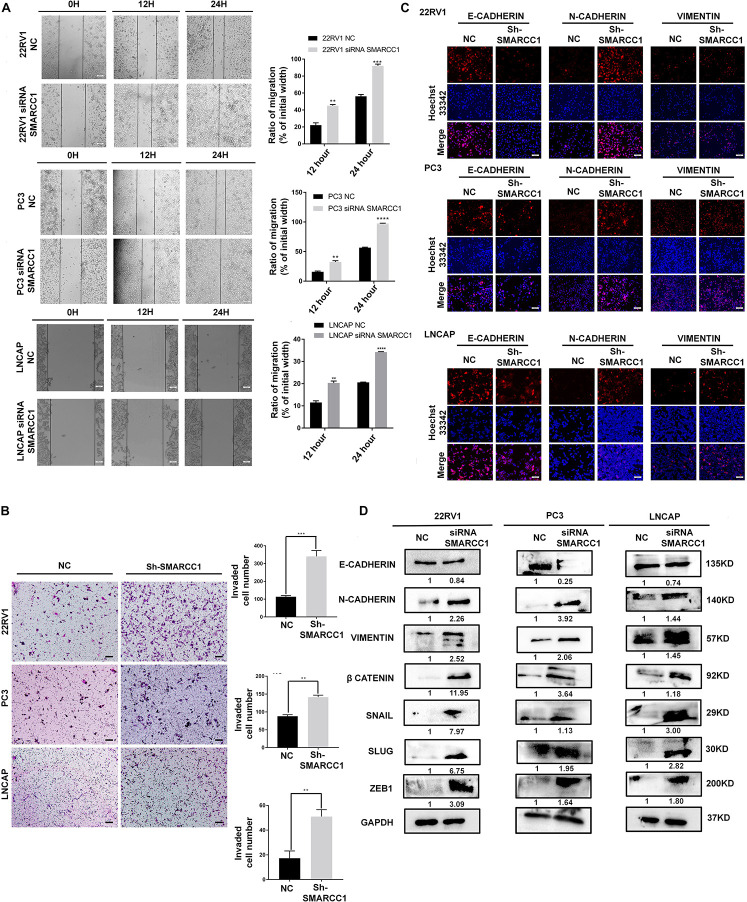
FIGURE 3.
SMARCC1 knockdown induced EMT, migration and metastasis of PCa. (A) Representative images showing in vitro wound area coverage by control and SMARCC1-knockdown PCa cells (left panel; magnification 100×; Scale bar – 10 μm) and percentage of migration (right panel). (B) Representative images showing migration of PCa cells in the Transwell assay (magnification 100×; Scale bar – 50 μm) and percentage of migrating cells. (C) Representative immunofluorescence images showing E-cadherin, N-cadherin and vimentin expression in PCa cell lines (Scale bar: 100 μm). (D) Expression of EMT markers and transcription factors involved in EMT in the indicated groups. Gray density values of proteins are indicated under the correspondent bands. All data are presented as mean ± SEM of at least three independent experiments. **p < 0.01;***p < 0.001; ****p < 0.0001.

