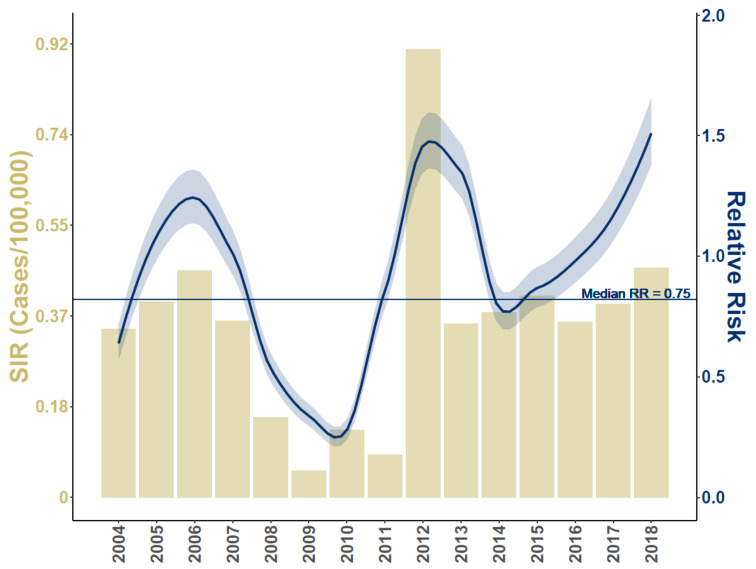
Figure 1.
Average Standardized Incidence Rates (SIR) and Relative Risk for period of record. Horizontal axis lists time (year), left vertical axis corresponds to histogram and describes the SIR (neuroinvasive Cases/100,000 people), and right vertical axis relates to curvlinear line and indicates estimated Relative Risk with respect to 2004–2018 median risk (straight, horizontal line at Relative Risk RR = 0.75). Shaded area around curvlinear line provides the 95% credible interval. Relative Risk is the ratio of model estimated disease cases to the expected case number given the population size. A Relative Risk value of 1 indicates that model predicted cases were comparable to the expectation, values below 1 indicate periods of relatively low risk, and values above 1 suggest increased risk.

