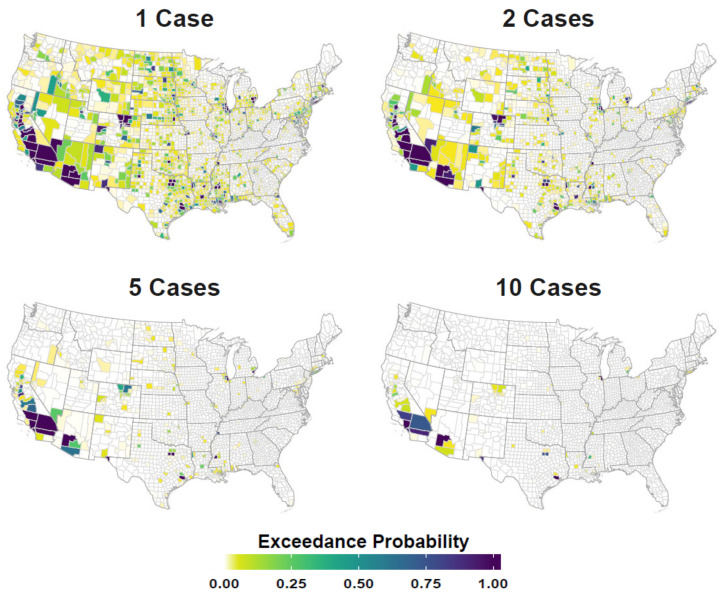
Figure 3.
Case exceedance probability. Figure displays the probability of counties having more than 1, 2, 5, and 10 neuroinvasive disease cases annually. Maps are color coded such that darker tones (deep blues) indicate higher exceedance probabilities (0.00–1.00) and lighter colors (greens and yellows) represent relatively lower probabilities.

