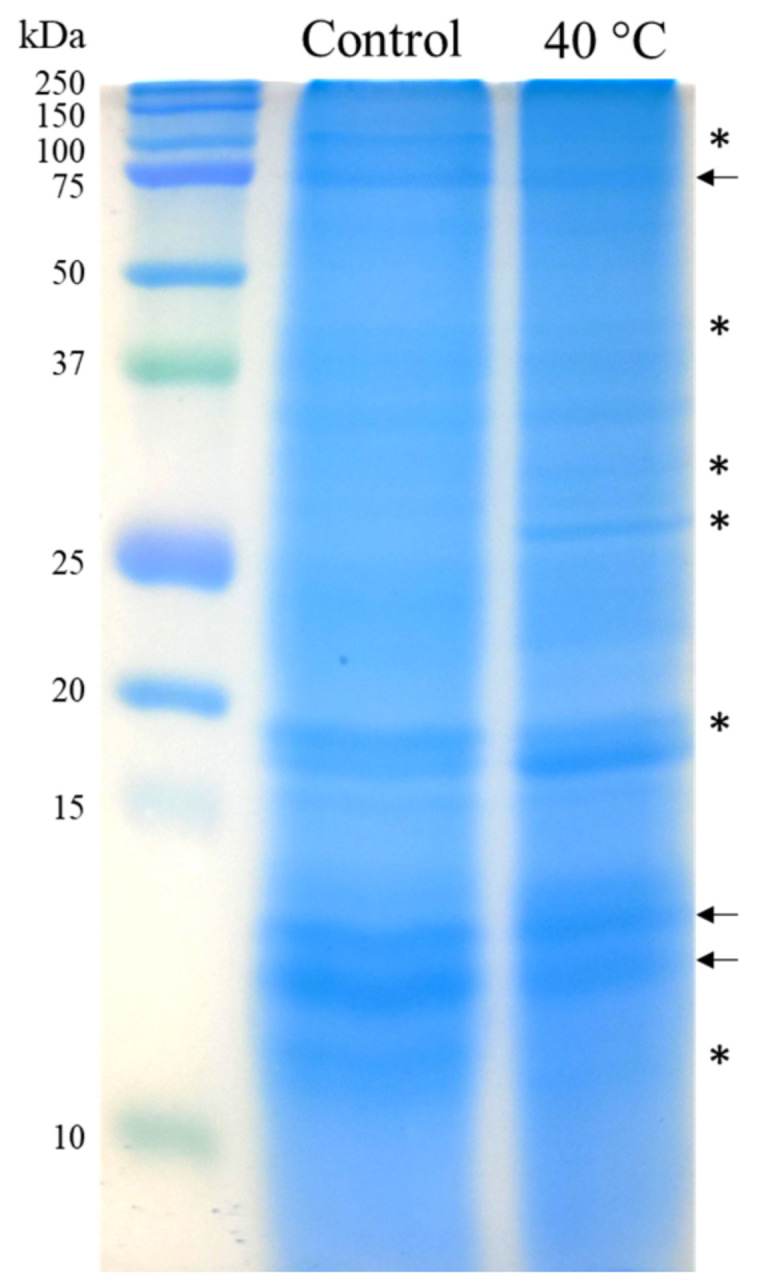
Figure A1.

The 1D-electrophoretic patterns of the proteins that were isolated from the purified cell walls of the B. distachyon leaves that had been treated at 40 °C and the control. Sixty µg of the proteins were analysed for each sample. After electrophoresis, the proteins were stained with Coomassie blue. Some of the bands of similar intensity across all treatments are marked with arrows. The bands differentiating plants treated at 40 °C from those at the control are marked with asterisks.
