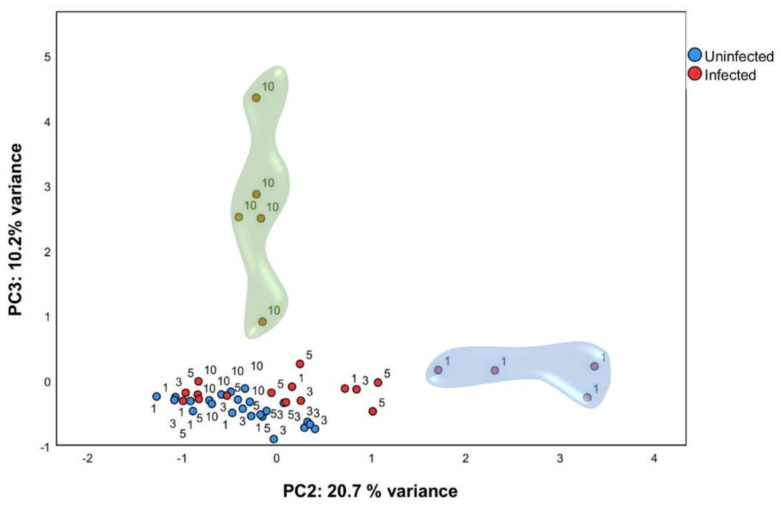
Figure 2.
Multivariate analysis identified particular gene expression profiles at one and ten days post infection. qPCR was carried out on liver tissue from control and L. infantum-infected mice and at 1, 3, 5, and 10 days post infection. Principal component analysis (PCA) plot. Principal components scores are shown on the X and Y axis, respectively, with the proportion of total variance related to that principal component (PC) indicated. Each dot represents a mouse in the corresponding day, and the color indicates the condition (red, infected; blue, control). The clouds highlight the group of ten days p.i. mice by PC3 (green cloud) and the group of one day p.i. mice by PC2 (blue cloud).

