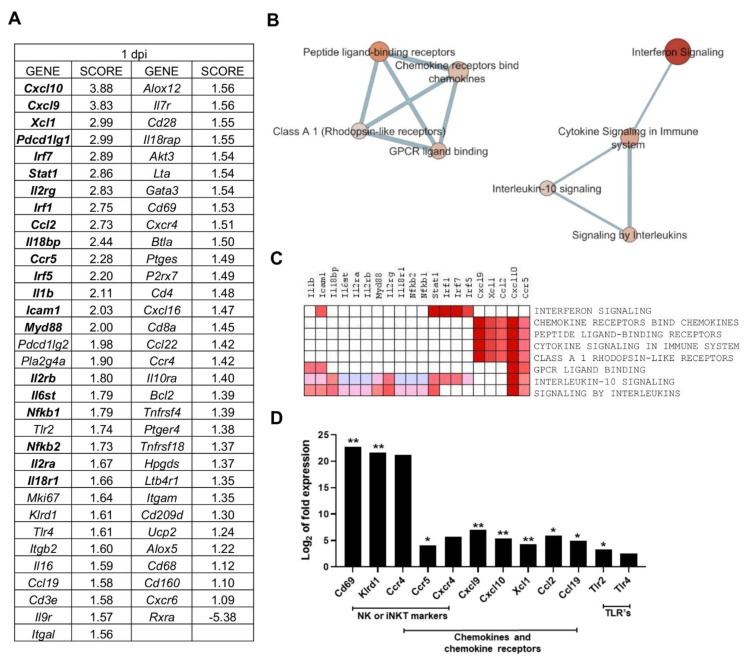
Figure 3.
Multiple processes are activated in L. infantum infection in livers of BALB/c mice at 1-day post inoculation: (A) Ranked gene list generated in Gene Set Enrichment Analysis (GSEA) (using Principal Component 2-correlated genes to compare gene expression in 1 day p.i.-mice group vs. all other mice). Genes indicated in bold were involved in the core enrichment; (B) Enrichment Map with Principal Component 2 (PC2)-correlated genes. Parameters to filter these nodes/gene sets applied in Cytoscape: p-value < 0.05 and False Discovery Rate (FDR) < 0.25. Intensity of node color fill represents FDR value (more intense red color indicates lower FDR); node size corresponds to the Normalized Enrichment Score (NES) value. Thicker connection lines represent higher similarity coefficient between nodes; (C) Core enrichment of PC2-gene sets. The leading edge analysis was performed in GSEA with the gene sets enriched (with p-value < 0.05 and FDR < 0.25). The heat map shows the clustered genes in the leading edge subsets. Score values in the ranked gene list generated in GSEA are represented as colors, where the range of color (red, pink) shows the range of score values (high, moderate); (D) mRNA expression of genes at 1-day post infection expressed as Log2 of expression fold-change. Statistically significant differences between non- infected (control) and infected animals are indicated (* p < 0.05; ** p < 0.01).

