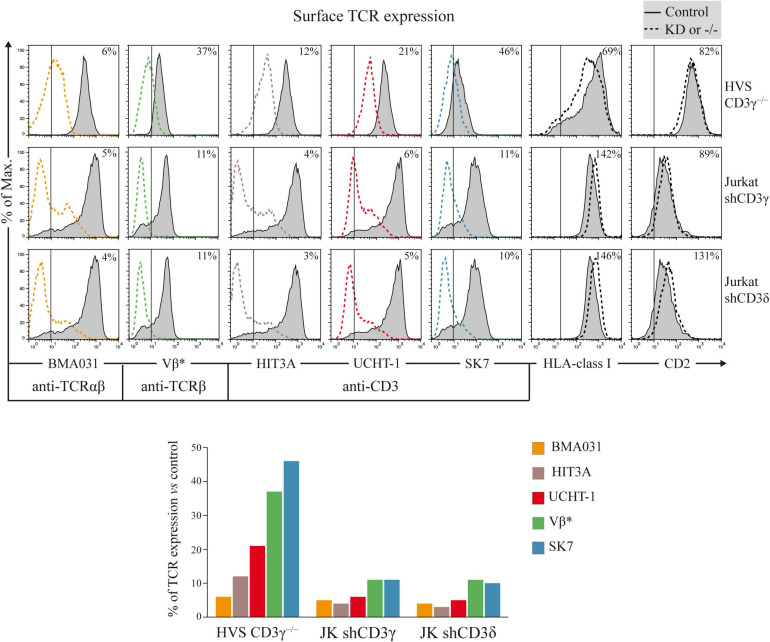
FIGURE 6.
Surface TCR expression in CD3G or CD3D KD T-cell lines. Top: cells were stained with labeled TCR- or CD3-specific mAb (BMA031, HIT3A, UCHT-1, Vβ*, and SK7) or with TCR-independent control mAb (anti-HLA-class I and anti-CD2). Expression was analyzed in HVS-CD3γ–/–, Jurkat shCD3γ, and Jurkat shCD3δ cells (dashed lines) compared with their relevant controls (HVS-CD3γ+/+ or Jurkat shNT, gray histograms, the latter shown twice as it is the control cell line for both CD3G and CD3D KD cell lines). The vertical line in each panel indicates the upper limit of background fluorescence using isotype-matched irrelevant mAb. The numbers in each histogram indicate geoMFI ratios (×100) relative to controls. Bottom: bar representation of TCR/CD3 geoMFI ratios relative to controls. *Vβ3- or Vβ8-specific mAb was used to stain the TCRβ chain in HVS or Jurkat cells, respectively, because they have different TCRB rearrangements.

