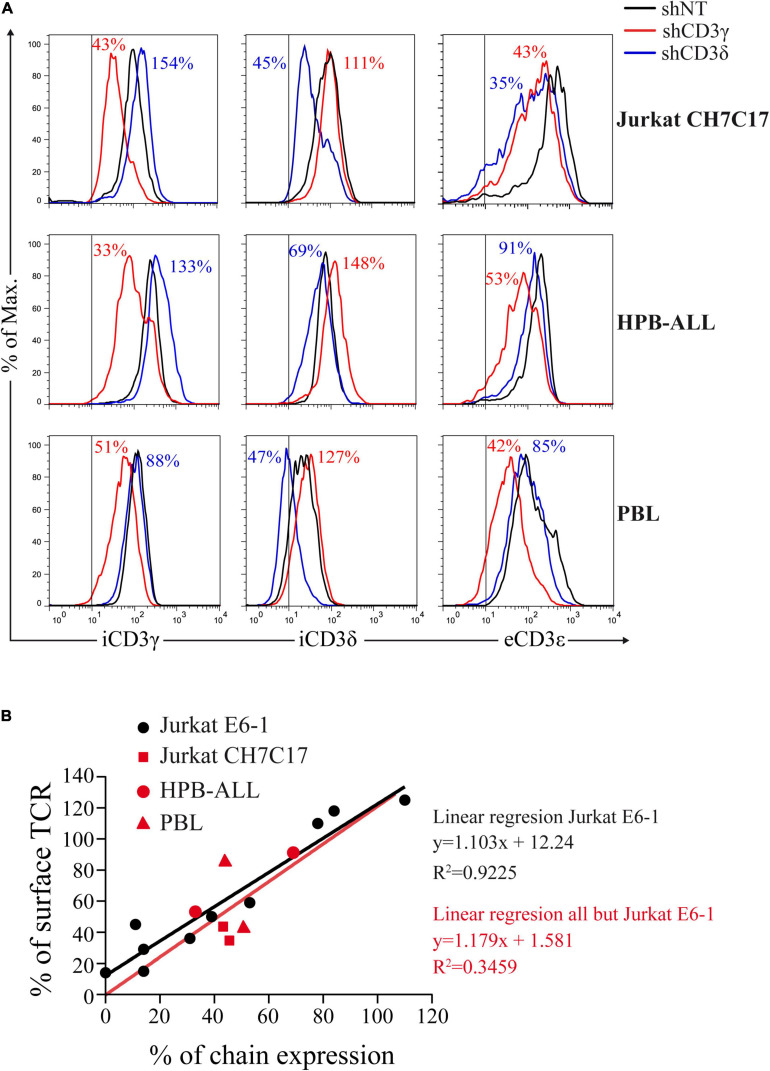
FIGURE 7.
CD3 KD and surface TCR expression correlate in T cells other than Jurkat E6-1. (A) Comparative intracellular (i) CD3γ or CD3δ expression and extracellular (e) CD3ε expression in the indicated T cells transduced with shCD3γ, shCD3δ, or shNT. Vertical lines indicate the upper limit staining of the isotype control. Numbers indicate % expression vs. control (shNT). (B) Correlation between CD3γ or CD3δ chain expression and surface TCR, expressed as % of expression vs. shNT. Data in (A) (red symbols) in comparison with Jurkat E6-1 data (black dots) and comparative linear regression. The slopes are not significantly different (P = 0.9046).

