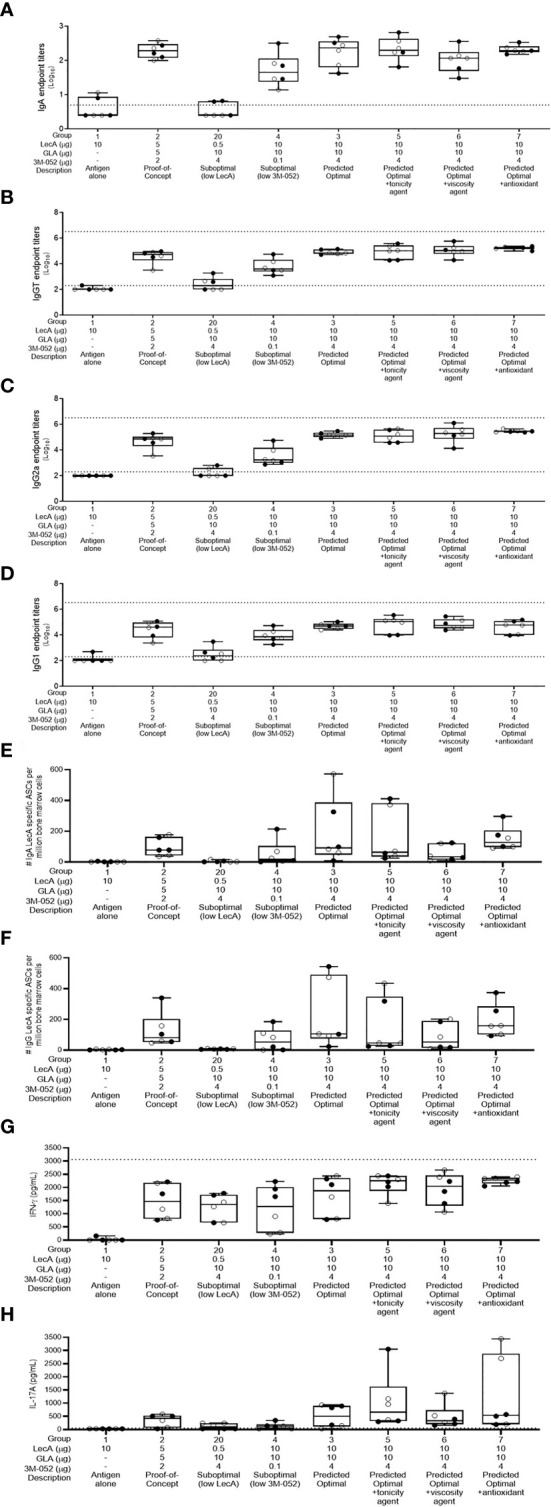
Figure 3.

Antibody and cellular immune responses elicited in mice 4 weeks following the last immunization in groups 1-7 and group 20 of the excipient composition immunogenicity study (see Supplementary Table 4 ). (A) stool LecA IgA titers, (B) plasma LecA IgG total titers, (C) plasma LecA IgG2a titers, (D) plasma LecA IgG1 titers, (E) LecA-specific IgA-secreting bone marrow cells, (F) LecA-specific IgG-secreting bone marrow cells, (G) LecA-specific IFNγ secretion by splenocytes, and (H) LecA-specific IL-17A secretion by splenocytes. For all panels, females are represented by closed circles and males by open circles. The box-whisker plots represent the median values (bars), the 25th-75th percentiles (boxes), and the minimum and maximum values (whiskers), with all points shown. Dotted lines indicate the upper and lower limits of quantitation; responses below the lower limit were arbitrarily set to 0.5x the lower limit, and no responses were detected above the upper limit.
