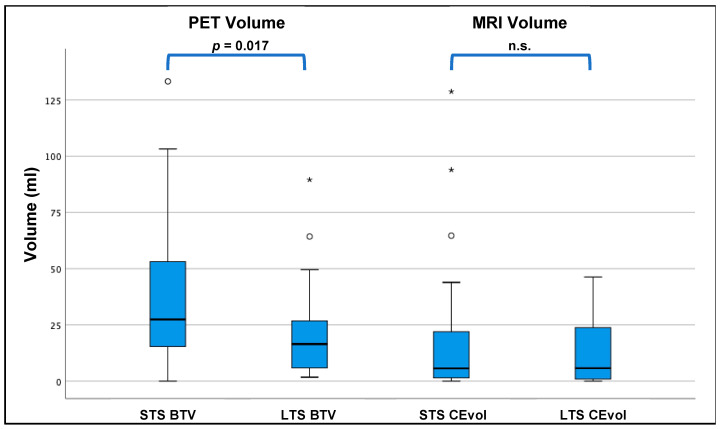
Figure 1.
Comparison of PET-based and MRI-based tumour volumes in LTS vs. STS: the PET-based BTV was significantly smaller in the LTS group compared to the STS group (16.5 vs. 27.4 mL; p = 0.017), whereas the volume of CE (CEvol) on MRI was comparable between STS and LTS (5.7 vs. 5.8 mL, p = 0.802). */° = outliers. N.s. = not significant.

