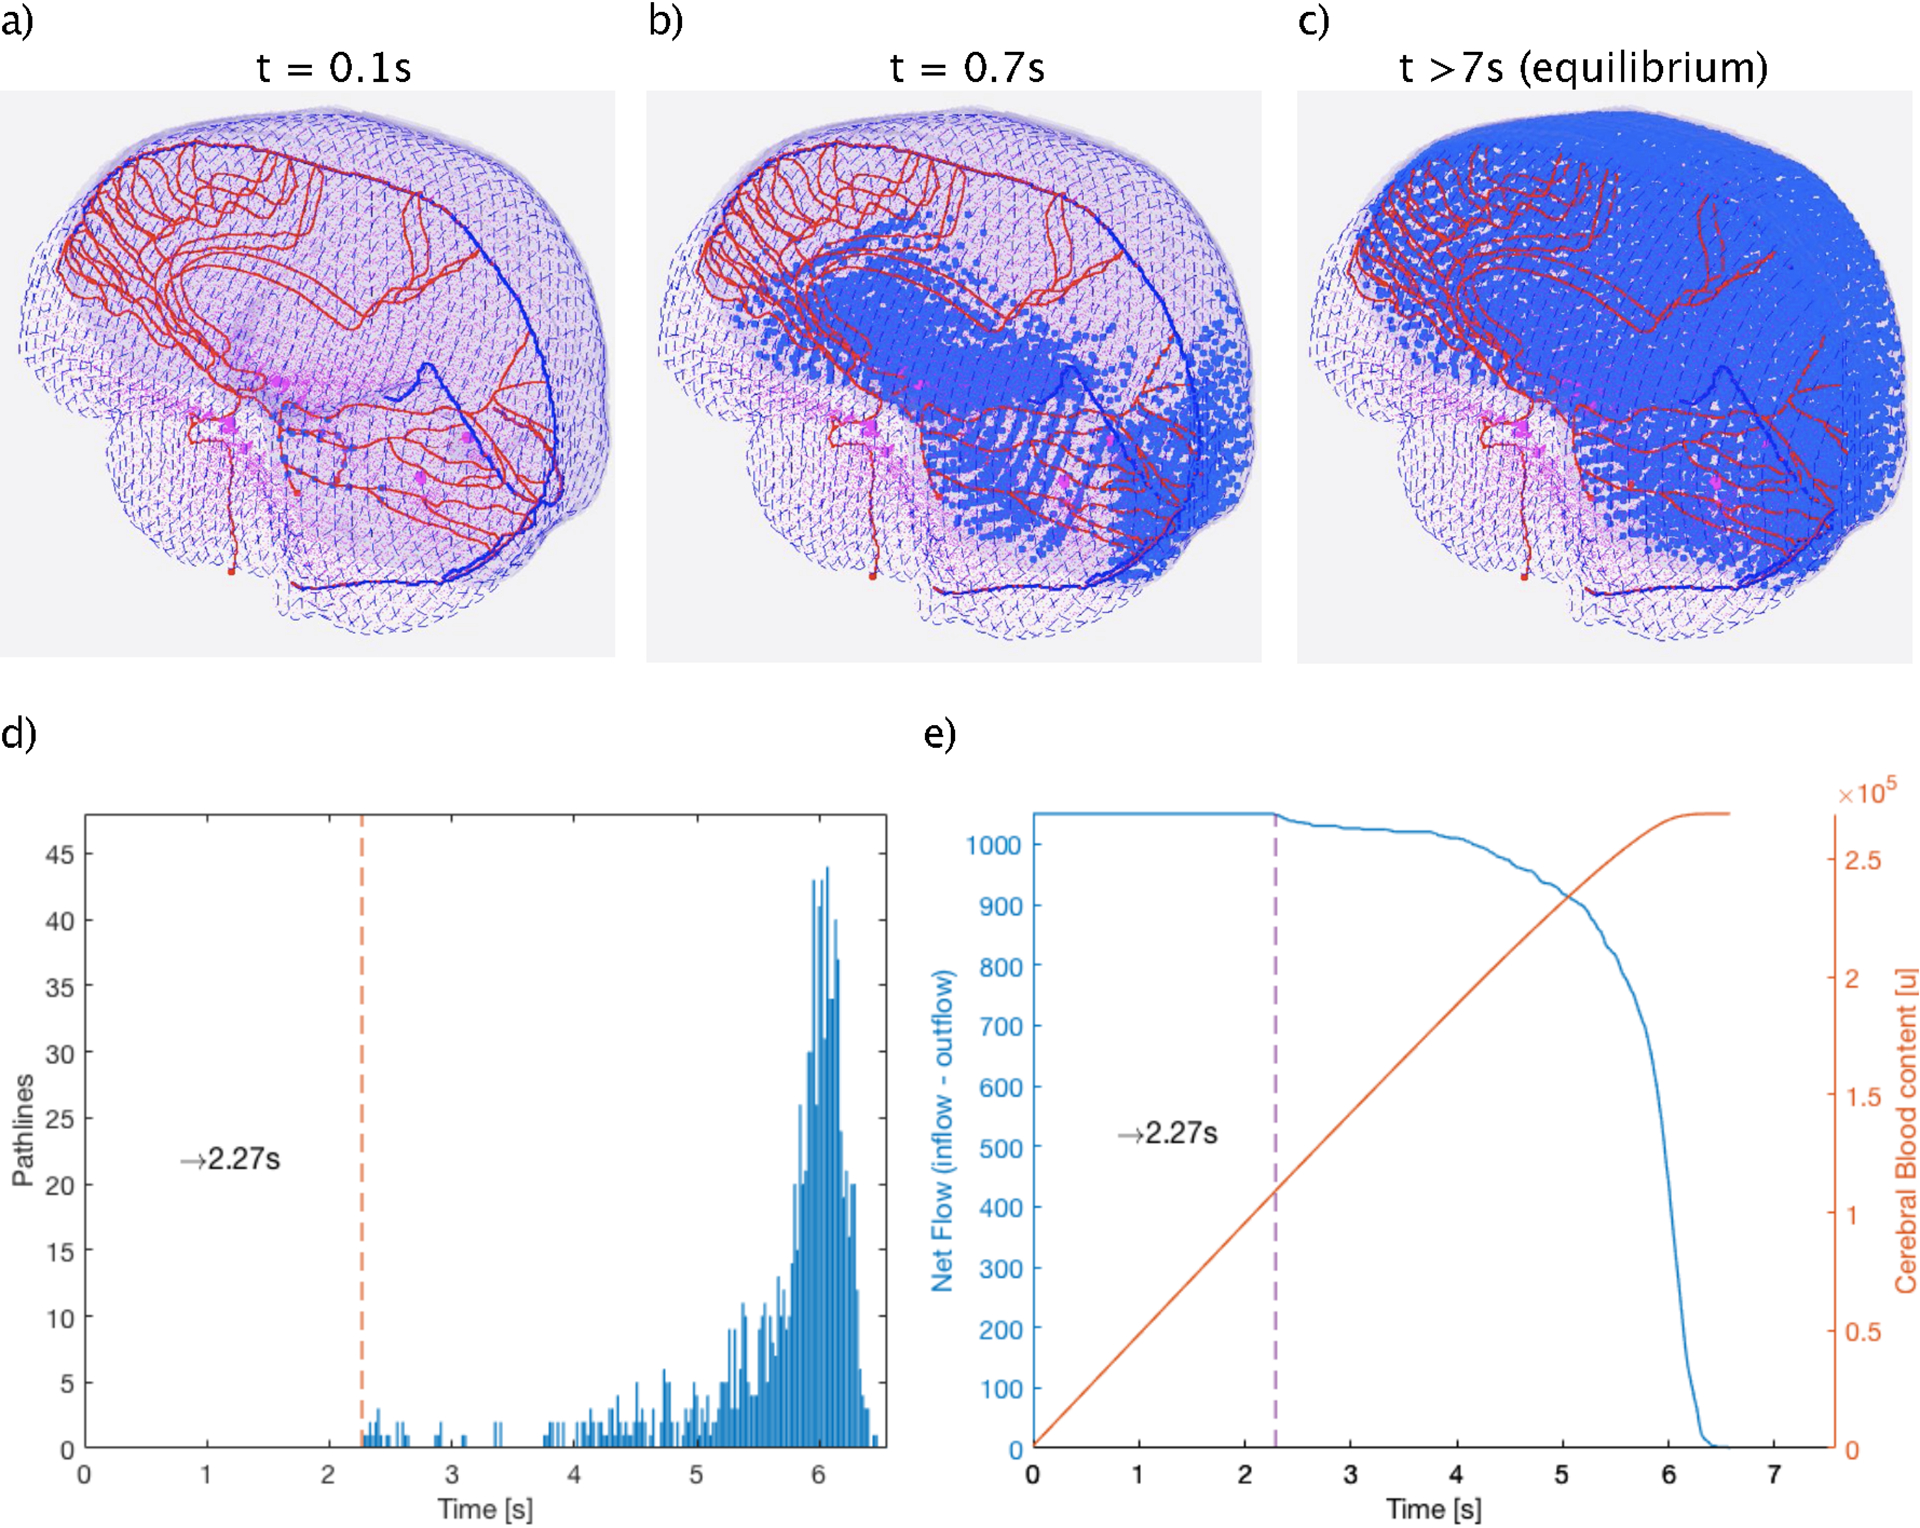
Figure 6:

(a-c), Frames of the blood flow model in the brain at three different times points during the path to equilibrium (a: t1=0.1s, b: t2=0.7s and c: t3>7s) showing the spatial and temporal propagation of the blood particles (blue points) along their path lines. d), The differential time distribution of the BP traveling through the vasculature model. Dashed vertical line indicates the shortest Time of Flight required to enter and leave the brain. e), (blue) Number of BPs entering the system at each time until equilibrium is reached and (orange) Evolution of the equilibrium state as function of the entering BPs.
