
Figure 2.
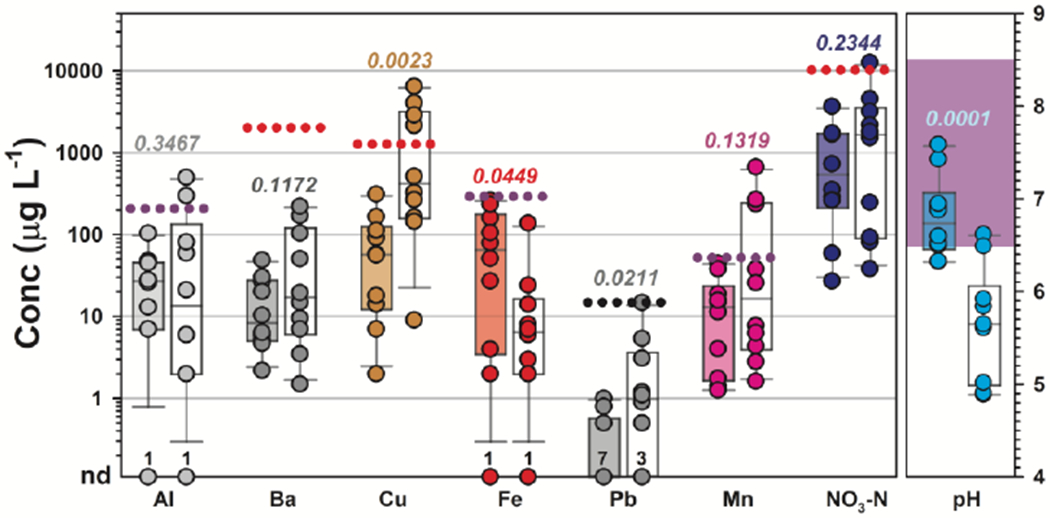
Concentrations (left, μg L−1) of aluminum (Al), barium (Ba), copper (Cu), iron (Fe), lead (Pb), manganese (Mn), and nitrate nitrogen (NO3-N) and pH (right) in samples of treated public-supply (shaded boxplots) and untreated private-supply (white boxplots) home tapwater collected during 2018 at Cape Cod, Massachusetts. Circles (●) are data for individual samples. Boxes, centerlines, and whiskers indicate interquartile range, median, and 5th and 95th percentiles, respectively. For each element (left), dotted lines indicate health-based National Primary Drinking Water Regulation Maximum Contaminant Level (MCL: Ba, Cu, NO3-N) and non-health-based National Primary Drinking Water Regulation Technology Treatment Action Level (Pb) or National Secondary Drinking Water Regulation standards (Al, Fe) for public supply. For pH (right), shaded area indicates National Secondary Drinking Water Regulation range for public supply. The MCL Goal (MCLG) for Pb is zero. Numbers above the x-axis indicate number of samples in which respective analytes were not detected (nd). Numbers above each boxplot pair indicate the permuted probability that the centroids and dispersions are the same (PERMANOVA; 9999 permutations).