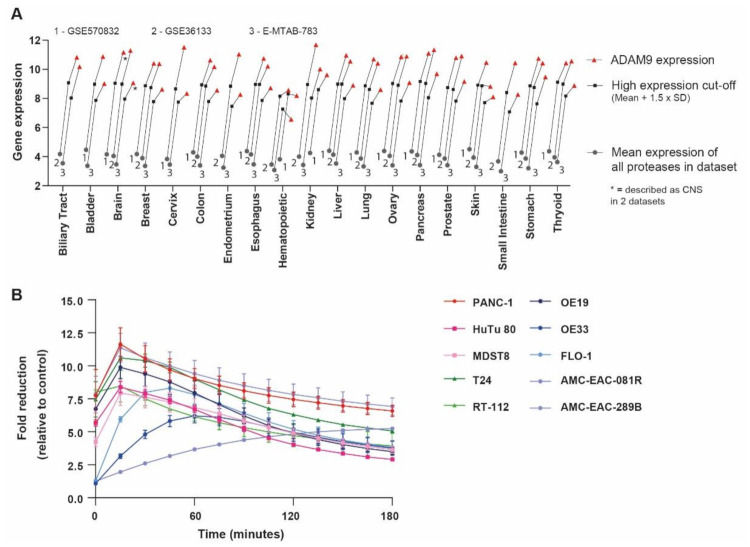
Figure 5.
ADAM9-MSNs may be applied to multiple cancer types. (A) Average ADAM9 expression in multiple cell lines of several cancer types. Gray circles represent the calculated average expression of all proteases per organ in the large sets of cancer cell lines (GSE36133, GSE57083, and E-MTAB-783); black squares represent the ‘high expression’ cut-off, determined as average protease expression × 1.5 times the standard deviation; red triangles indicate the ADAM9 expression levels. (B) ADAM9-substrate cleavage by conditioned media collected from several cancer cell lines. Data are the mean of three experiments performed in duplicate.

