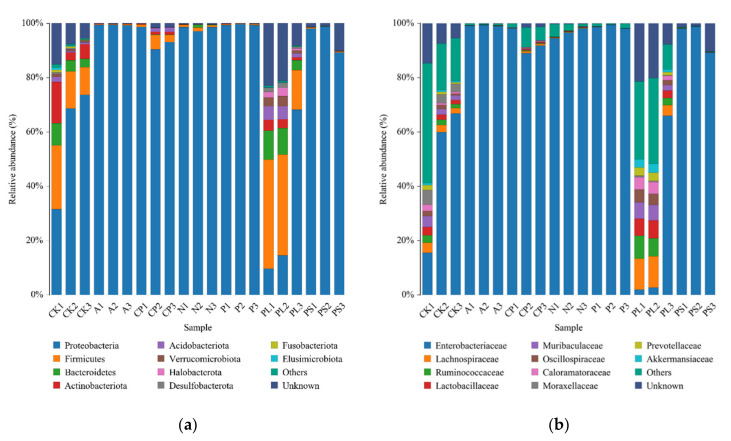
Figure 3.
Bacterial composition of the top 10 relative abundances at (a) the phylum level and (b) the family level. Each color represents a species, and the height of the color block indicates the proportion of the species in relative abundance. Other species are incorporated as “Others” shown in the diagram. “Unknown” represents species that have not received a taxonomic annotation.

