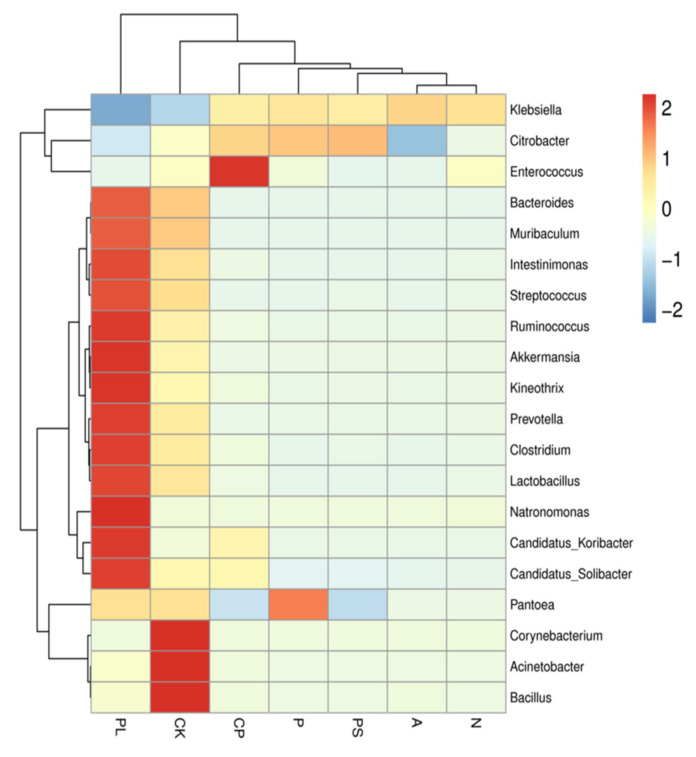
Figure 4.
Cluster heat map of the 20 most abundant genera in the bacterial community. The columns represent the samples and the rows represent the bacterial OTUs assigned to the genus level. Dendrograms of hierarchical cluster analysis grouping genera and samples are shown on the left and at the top, respectively.

