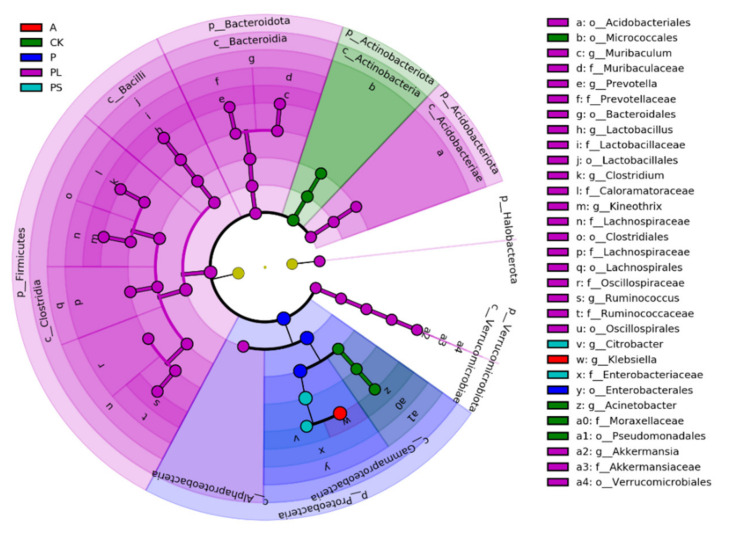
Figure 7.
Cladogram of bacterial biomarkers, from the phylum (innermost ring) to genus (outermost ring) level, with an LDA score > 4. Differential bacterial taxa are marked by lowercase letters. Each small circle at different taxonomic levels represents a taxon at that level, and the diameter of the circle is proportional to the relative abundance. The coloring principle is to color the species with no significant difference as yellow, and the other different species as the group with the highest abundance of the species. Different colors represent different groups, and nodes with different colors represent the communities that play an important role in the group represented by the color.

