Figure 2.
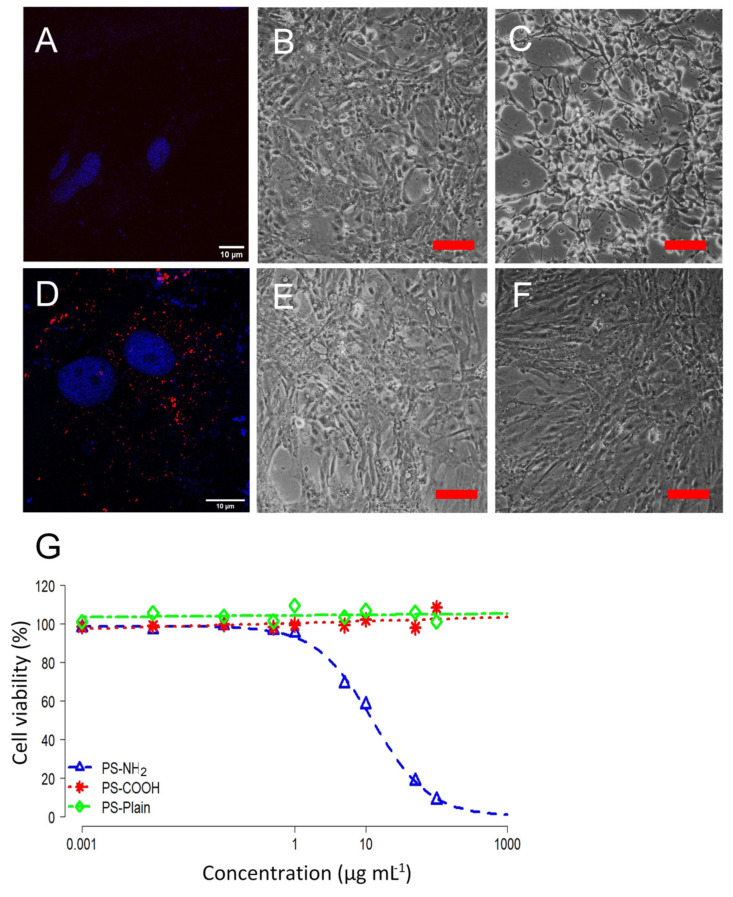
Cytotoxicity of SaB-1 cells exposed to functionalized polystyrene nanoplastics (PS-NH2, PS-COOH and PS-Plain) for 24 h. Representative confocal fluorescence microscopy images of unexposed SaB-1 cells (A) or exposed to 12 μg mL−1 of red PS-COOH for 24 h (D). Blue and red fluorescence indicate cellular DNA (DAPI) and PS-COOH (Micromer®-redF), respectively. Scale bar is fixed at 10 µm. Representative phase contrast microscope images of SaB-1 cell cultures unexposed (B; Control) or exposed for 24 h to 12 µg mL−1 of PS-NH2 (C), PS-COOH (E) or PS-Plain (F). Scale bar represents 100 μm. (G). Cytotoxicity curves of SaB-1 cells exposed to functionalized polystyrene nanoplastics. Percent cell viability is calculated as percentage of the control or unexposed cells (n = 3) and lines represent the fitted curves.

