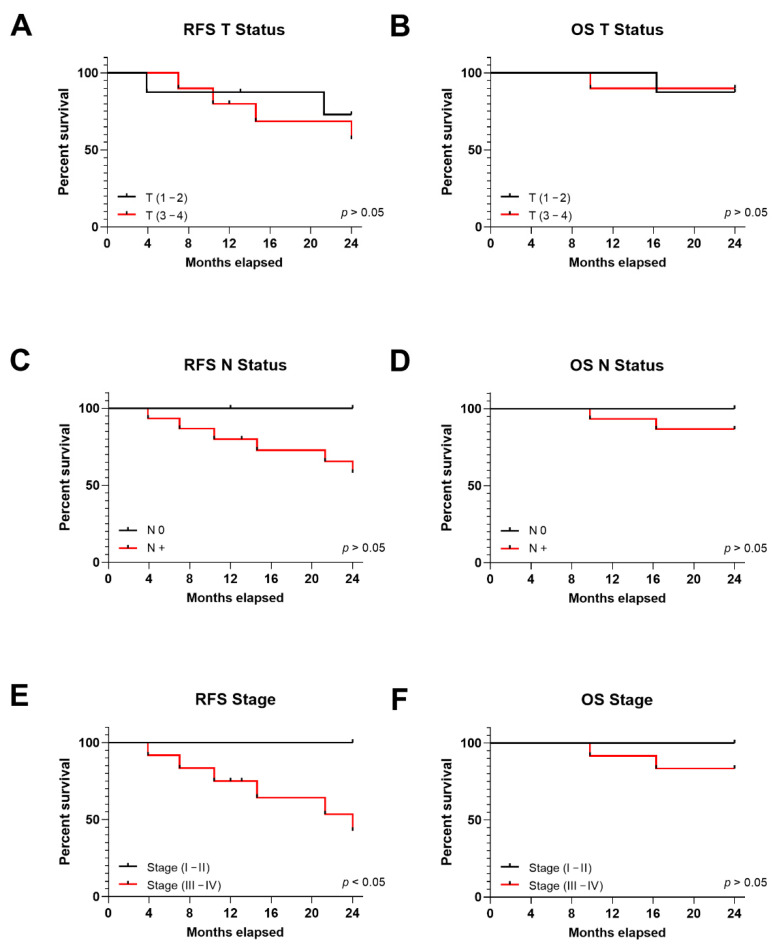
Figure 5.
Kaplan-Meier (KM) curves for tumor size (T), node status (N) and stage in HPV-positive HNSCC patients representing RFS and OS; KM representing (A) RFS and (B) OS for patients divided into tumor size: T (1–2) and T (3–4); KM representing (C) RFS and (D) OS for patients divided into node status: N0 and N+; KM representing (E) RFS and (F) OS for patients divided into stages I/II and III/IV; OS for patients divided into stages I/II and III/IV. Statistical significance was indicated as p < 0.05.

