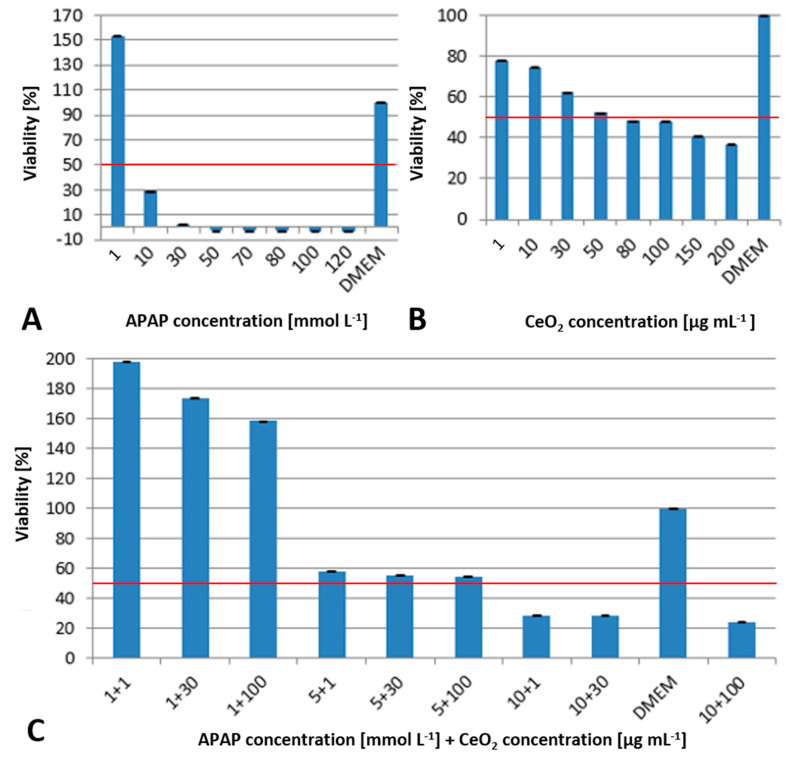
Figure 3.
Results of the WST-1 assay after 48 h exposure of HuH-7 cells to APAP (A), CeO2 NPs (B) and both in combination (C) at different concentrations ± standard deviation normalized to negative control (DMEM) and positive control (TritonX). Red line indicates the EC50. All tests with one biological and six technical replicates.

