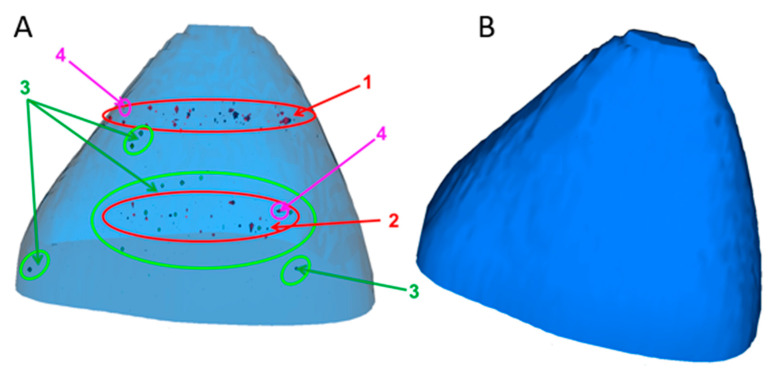
Figure 6.
Time-of-flight secondary ion mass spectrometry (ToF-SIMS) ion reconstruction of the 3D depth profile (20 µm × 15 µm × 3.5 µm) of a single HuH-7 cell, which was co-exposed to CeO2 NPs (100 µg mL−1) and 5 mmol L-1 APAP for 24 h. CeO2 NP aggregates are shown in red color (red circle), APAP-CeO(OH) particles are shown in green color (green circle). 1 and 2 (red) indicates the intracellular location of CeO2 NPs agglomerates, 3 (green) indicates the intracellular localization of APAP-CeO(OH) particles, whilst 4 (pink) indicates the localization of mixed agglomerates of CeO2 NPs and APAP-CeO(OH) particles. The cell membrane is being visualized in translucent (A) or solid (B) blue and reconstructed from the C3H8N+ signal that originates from phosphatidylcholine.

