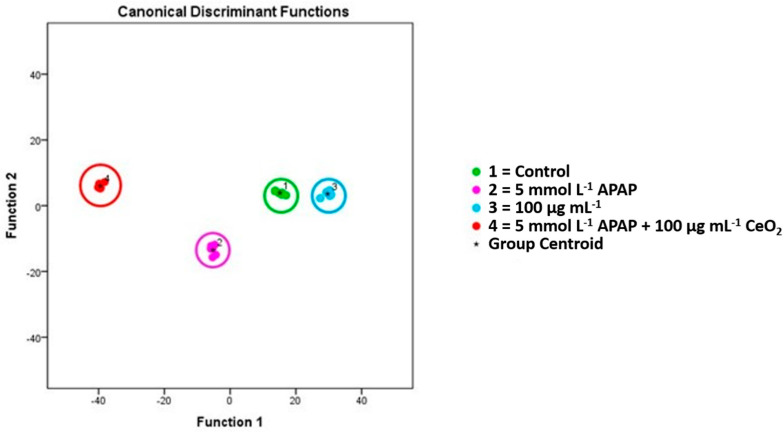
Figure 10.
Metabolic changes of HuH-7 cells after treatment with APAP (5 mmol L−1), CeO2 NPs (100 µg mL−1) and APAP (5 mmol L−1) plus CeO2 NPs (100 µg mL−1). The diagram shows the values of the discriminant scores obtained from Fisher’s discriminant analysis of 24 HuH-7 samples for 78 principal compounds, which were selected to discriminate between cells treated with APAP (5 mmol L−1), CeO2 NPs (100 µg mL−1) and APAP (5 mmol L−1) plus CeO2 NPs (100 µg mL−1). All four groups can be well separated from each other. The model was evaluated using the “leave-one-out” formalism (100% correct grouping of ungrouped cases).

