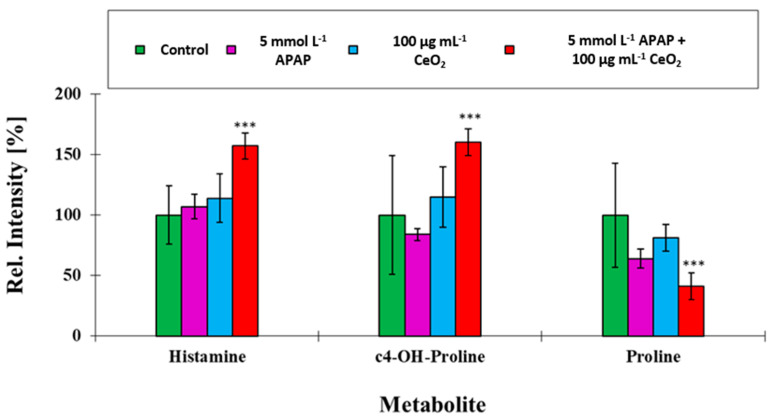
Figure 11.
Comparison of ion yields for characteristic biomarker metabolites addressed in the targeted metabolomics experiment of cells co-exposed to APAP (5 mmol L−1) and CeO2 NPs (100 µg mL−1). These metabolites were used to separate the four treatment groups. The mean of the control group of unexposed HuH-7 cells was taken as 100% in all cases. ***: p ≤ 0.05.

