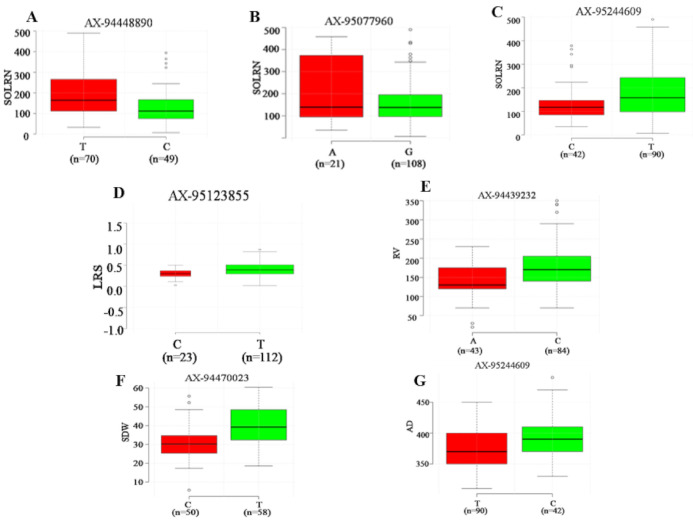
Figure 5.
Boxplot for seven reliable QTNs with significant effects (p < 0.01) on corresponding root and shoot traits. For each QTNs, the germplasm lines were divided into two groups according to superior and inferior allele type. The x-axis represents the two alleles for each QTNs, while the y-axis corresponds to phenotypic value. Subfigures, (A–C) represent allelic differences for SOLRN and superior alleles for QTNs Q.SOLRN-1DS, Q.SOLRN-1BL and Q.SOLRN-6AL were T, A and T respectively. Subfigures (D–G) represent allelic differences for LRS, RV, SDW and AD for QTNs Q.LRS-7BS, Q.RV-5BL, Q.SDW-4AL and Q.AD-6AL with superor alleles as T, C, T and C respectively.

