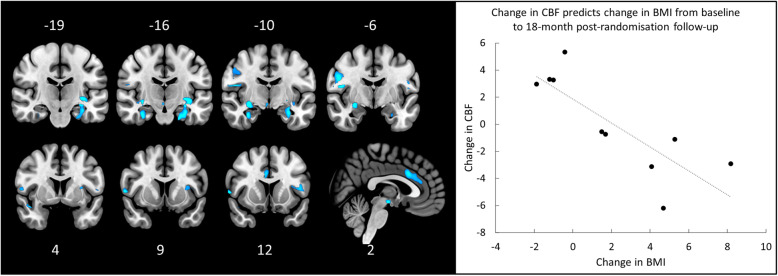
Fig. 3.
Left: Brain regions where rTMS-related change in CBF significantly predicts sustained increases in BMI at the 18-month post-randomisation follow-up. Right: Scatter plot, with trend-line added, illustrating the association between change in CBF (baseline to post-treatment [1-month post-randomisation]) and change in BMI (baseline to 18-months post-randomisation), while controlling for AN type and chronicity i.e., reduction in CBF during treatment is associated with long-term increases in BMI. Brain images shown at an uncorrected threshold of p < 0.005, slice numbers are in MNI space

