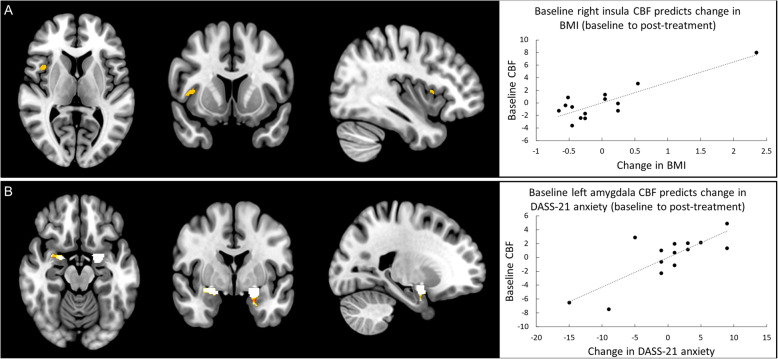
Fig. 4.
A Left: Brain regions where baseline CBF significantly predicts change in BMI between baseline and post-treatment (1-month post-randomisation). Right: Scatter plot, with trend-line added, illustrating the association between baseline CBF and change in BMI, while controlling for AN type and chronicity i.e., lower baseline right insula CBF is associated with increases in BMI. B Left: Brain regions where baseline CBF significantly predicts change in DASS-21 anxiety between baseline and post-treatment (1-month post-randomisation). Right: Scatter plot, with trend-line added, illustrating the association between baseline CBF and change in anxiety, while controlling for AN type and chronicity i.e., lower baseline left amygdala CBF is associated with a reduction in anxiety. Brain images shown at an uncorrected threshold of p < 0.005, slice numbers are in MNI space

