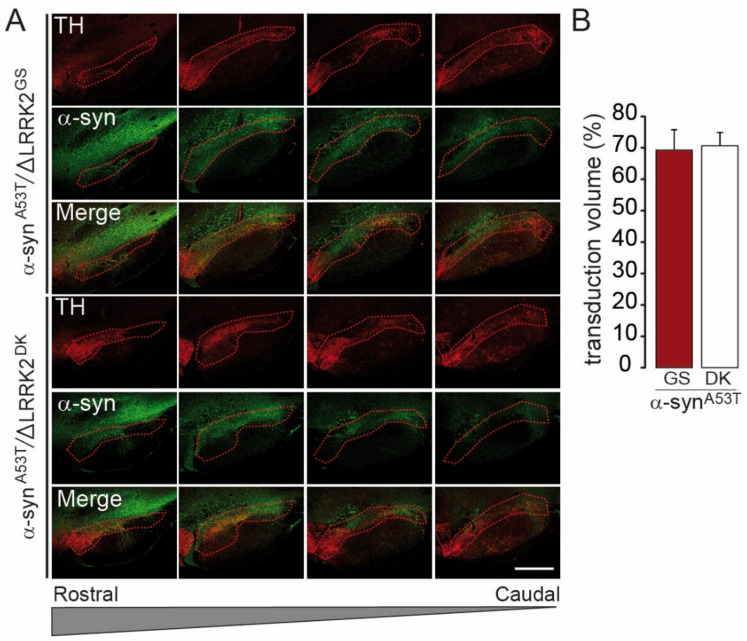
Figure 7.
Measurement of the SNpc volume transduced by AAV-ΔLRRK2G2019S and the dead kinase form ΔLRRK2G2019S/D1994A. (A) Confocal images to delineate the SNpc based on TH staining (in red), reported in the green channel, corresponding to the α-syn immunofluorescence when co-expressed with ΔLRRK2G2019S (ΔLRRK2GS) or ΔLRRK2DK, the dead kinase form ΔLRRK2G2019S/D1994A. Scale bar: 1000 µm. (B) Quantification of the fraction (%) of the SNpc expressing α-syn protein after co-transduction with ΔLRRK2G2019S or ΔLRRK2G2019S/D1994A. Results are expressed as the means ± SEM. N = 8 animals/group. No statistical difference, Student’s t-test.

