Fig. 1.
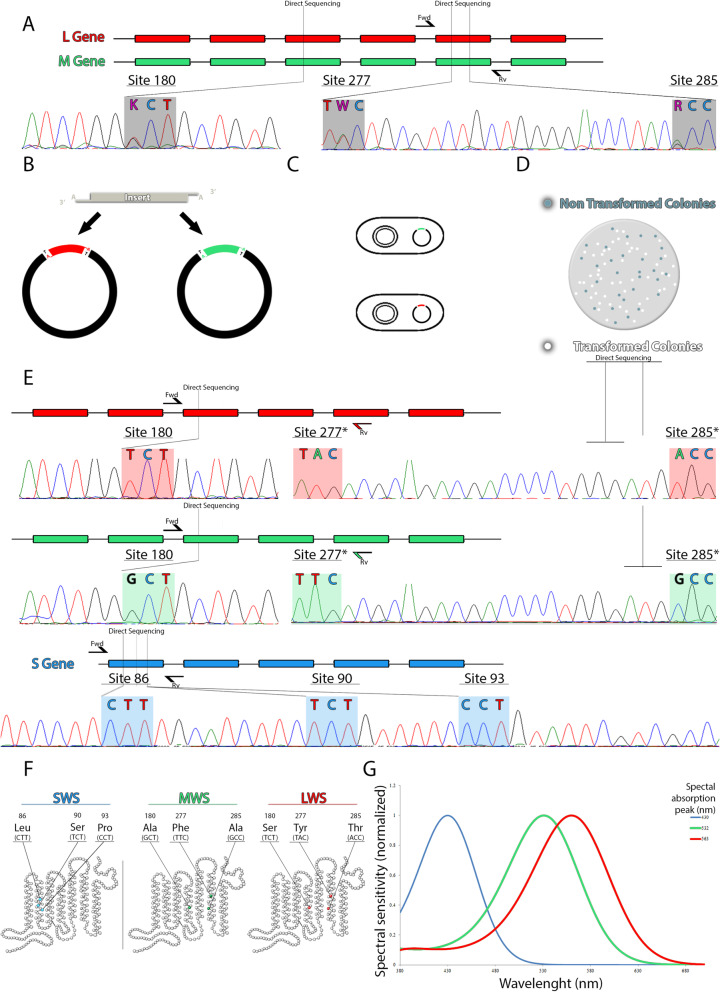
Molecular biology procedures used to estimate the spectral sensitivity curves of the three opsins of Alouatta caraya and Alouatta seniculus. This figure is a representation - proportion and scales are oversimplifications for better readability. A Exons 3 and 5 of the mws and lws opsin genes were amplified by PCR, directly sequenced, and the resulting chromatograms showed heterozygous sites (highlighted in grey). B The amplified exon 5 of the mws and lws genes were inserted into plasmid vectors, which were used to transform competent E. coli (C). D Bacterial colonies were white-blue screened, and multiple individual white clones were grown, purified and sequenced. E Sequencing results enabled us to identify the exon 5 of each gene, separately, and to design reverse primers specific for each gene in the exon 5. Exons 3 to 5 of mws and lws genes were amplified using the forward primers for exon 3 in each gene and the reverse primers designed in the exon 5. Exon 1 of sws1 gene were sequenced in order to identify the amino acids at the critical spectral tuning sites. *The chromatogram of the exon 5 of mws and lws were drawn from reverse sequences. In order to keep the nomenclature, standard the codon sequences were presented. F, G Based on the amino acids located at the spectral tuning sites we predicted the spectral sensitivity peak of each opsin. G Spectral absorbance curves were inferred from the spectral peaks and based on Stockman and Sharpe [23] template

