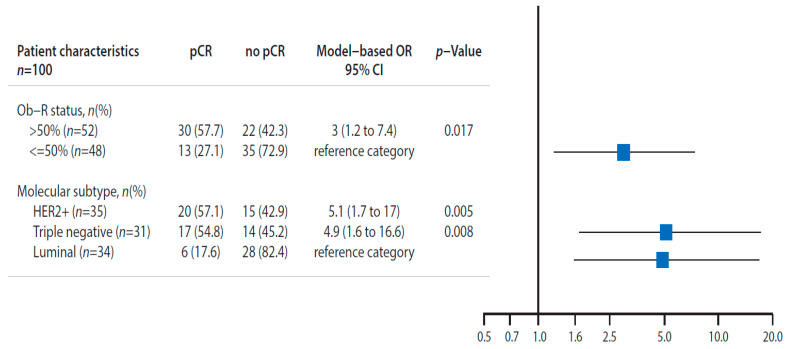
Figure 3.
Pathological complete response in accordance with Ob-R overexpression (>50%). Multivariate logistic regression model analysis. The multivariate analysis has included all prognostic factors reported in Table 1 in the full model. Factors included in the final model have been selected at a p-value of <0.1 or change in OR > 10% compared to the full model. The factors selected in final model are presented. The pCR rate was significantly greater in patients with Ob-R overexpression (>50%) than patients without Ob-R overexpression (≤50%). In addition the HER2+ and triple negative patients has a pCR significantly greater than luminal patients. 95% CI: 95% confidence interval; Ob-R: Leptin receptor; pCR: pathological complete response; HER2: Human epidermal growth factor receptor 2.

