Fig. 4.
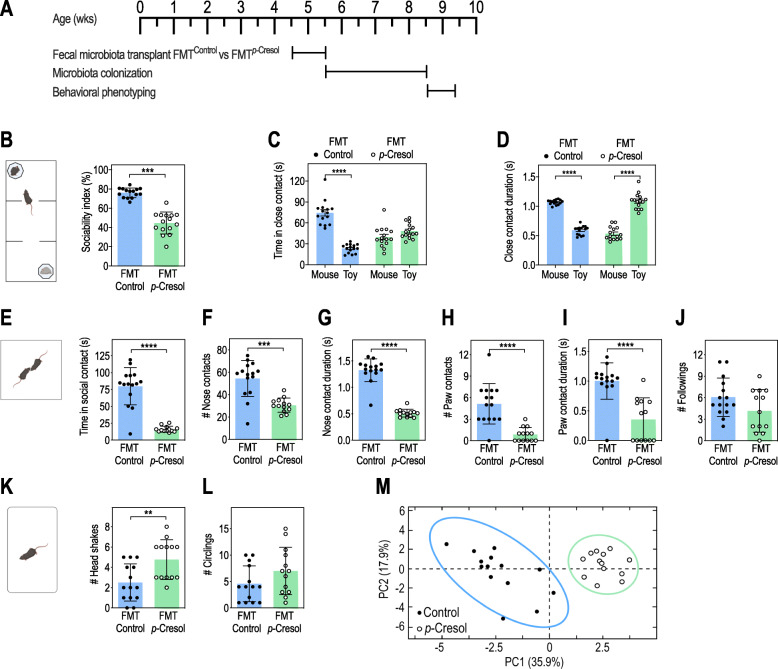
Microbiota remodeling following p-Cresol treatment induces social behavior deficits. A Timeline of the fecal microbiota transplant experiment from control (FMTControl) or p-Cresol-treated donor animals (FMTp-Cresol) to recipient untreated mice. B–D Three-chamber test (n = 15/group): B Sociability index (percentage of the time spent in close contact with the mouse interactor relative to the total time in close contact with both mouse interactor and toy mouse); Mann-Whitney U-test: ***p < 0.001. C Time spent in close contact with the mouse interactor or the toy mouse; 2-way ANOVA: p (FMT) = 0.1507, p (Preference) < 0.0001, p (FMT × Preference) < 0.0001; Šidák’s post hoc tests for mouse vs. toy preference effect: ****p < 0.0001 for FMTControl group, p > 0.05 for FMTp-Cresol group. D Mean duration of each close contact with the mouse interactor or the toy mouse; 2-way ANOVA: p (FMT) = 0.1191, p (Preference) = 0.4639, p (Treatment × Preference) < 0.0001; Šidák’s post hoc tests for mouse vs. toy preference effect: ****p < 0.0001. E–J Dyadic social interaction test (n = 15 FMTControl, n = 13 FMTp-Cresol): E Total time spent in social contact; Mann-Whitney U-test: ****p < 0.0001. F Number of nose contacts; Mann-Whitney U-test: ***p < 0.001. G Mean duration of nose contact; Mann-Whitney U-test: ****p < 0.0001. H Number of paw contacts; Mann-Whitney U-test: ****p < 0.0001. I Mean duration of each paw contact; Mann-Whitney U-test: ****p < 0.0001. J Number of followings; Mann-Whitney U-test: p = 0.1563. K, L Motor stereotypies (n = 14 FMTControl, n = 13 FMTp-Cresol): K Number of head shakes; Mann-Whitney U-test: **p < 0.01. L Number of circling events; Mann-Whitney U-test: p = 0.1762. M PCA plots of behavioral scores recorded in the dyadic social interaction test and direct monitoring of motor stereotypies (E–L, Supplementary Figure 4H-K); ellipses of the 95% confidence intervals are indicated for each group (n = 15 FMTControl, n = 13 FMTp-Cresol). B–L Data are presented as dot-plots featuring means ± SD

