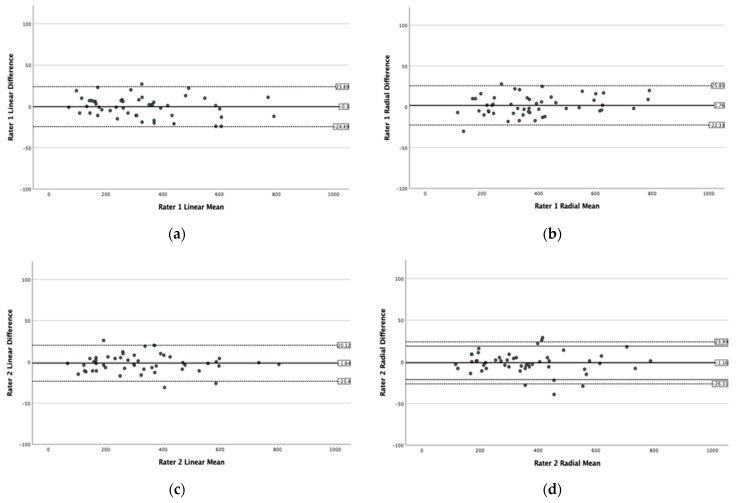
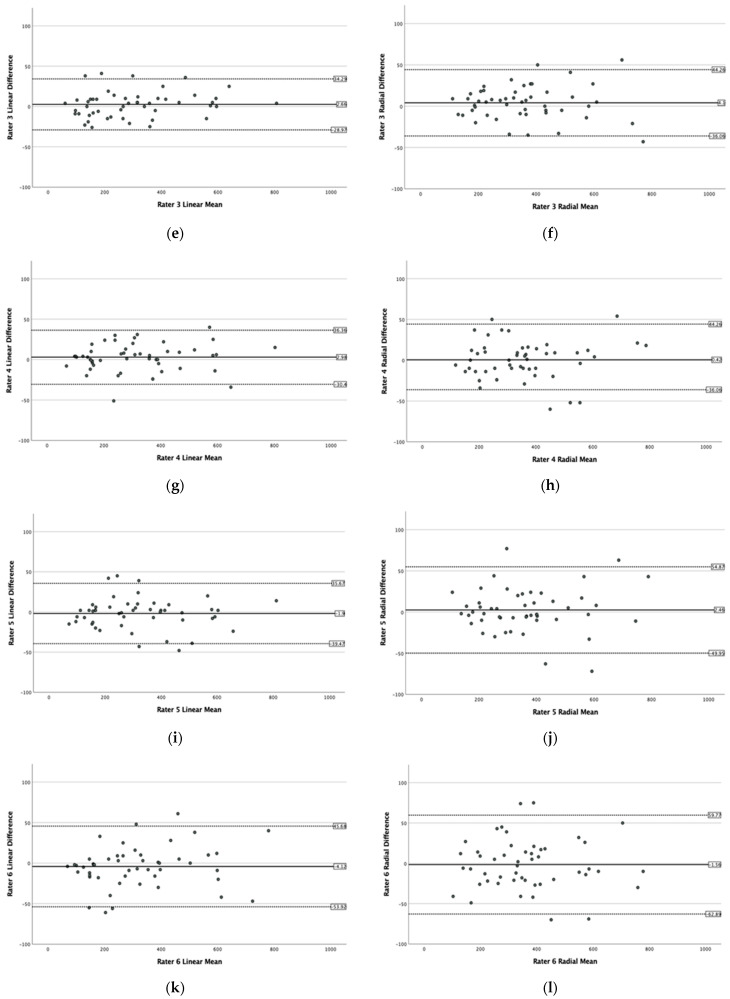
Figure 1.
Bland–Altman plots of the MH size (MLD) measurements obtained by the six raters in the horizontal linear and the radial OCT scan modes with no systematic bias. (a–l) The x-axis displays the mean size of the MLD measurements of the MHs and the y-axis, the difference between the two readings of each rater.


