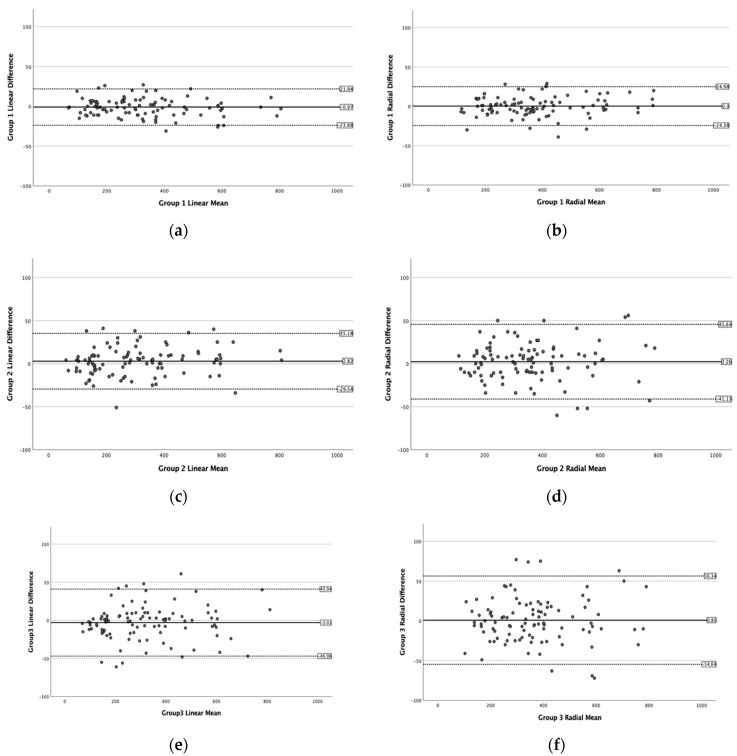
Figure 2.
Bland–Altman plots of the MH size (MLD) measurements obtained by the three groups in the horizontal linear and the radial OCT scan modes with no sign of systematic bias. (a–f) The x-axis displays the mean size of the MLD measurements of the MHs and the y-axis the differences between the readings within each group.

