Fig. 9.
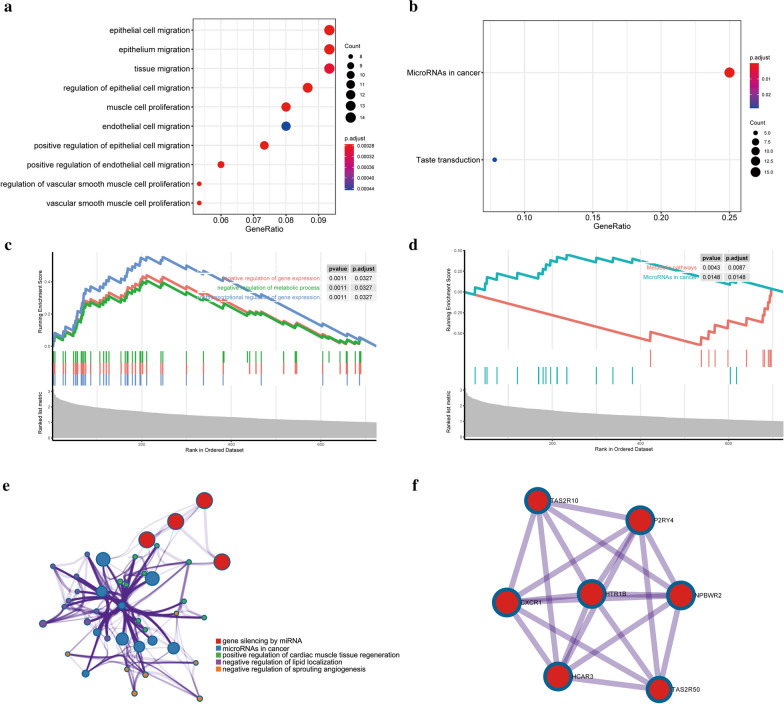
Functional analysis. a, b Significantly enriched GO terms (a) and KEGG pathways (b) of differentially expressed genes (DEGs). The color scale represented p value and the circle size indicated count. c, d Gene set enrichment analysis (GSEA) of GO (c) and KEGG (d). The crest on the left represents the high expression of the enriched genes in the high-risk group, while the crest on the right is the opposite. e Cluster ID. Nodes with the same cluster ID are typically close to each other and the same color indicates the same cluster ID. f The key module of PPI network. Seven hub genes were included in the interaction network. Circles indicate the genes in the PPI network, and the connection indicates the potential interaction between different mRNAs

