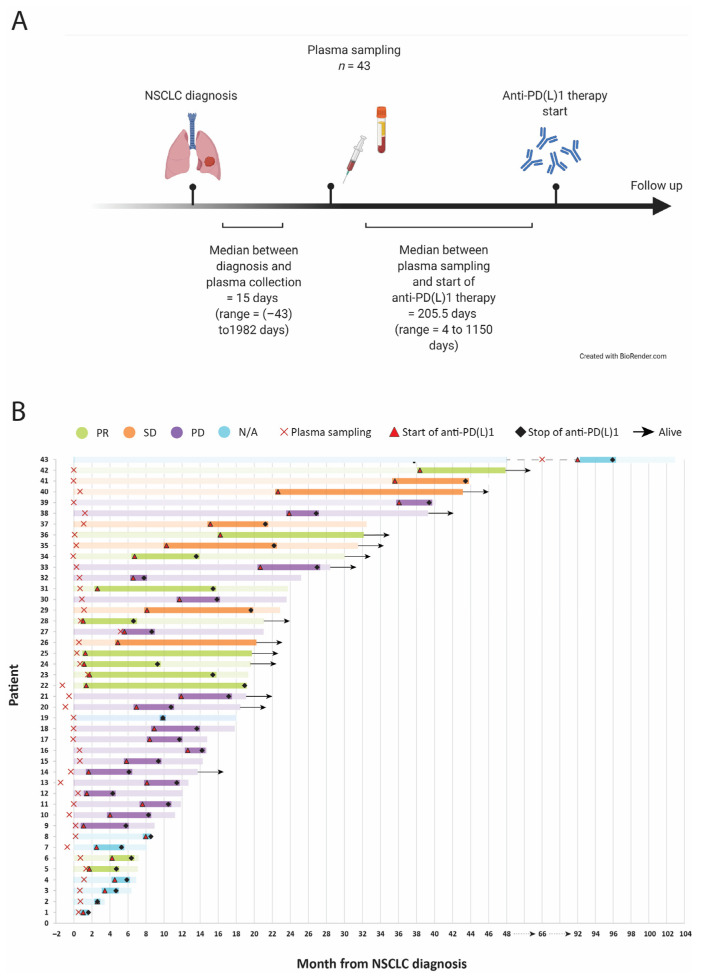
Figure 1.
Workflow and clinical events. (A) Sequential workflow for diagnosis, sampling, and therapy initiation. The number of samples (n), the median days, and the time range between sampling and diagnosis or therapy start are noted. (B) Swimmer plot illustrating the individual patients’ clinical courses of treatment start and stop, sampling, and outcome.

