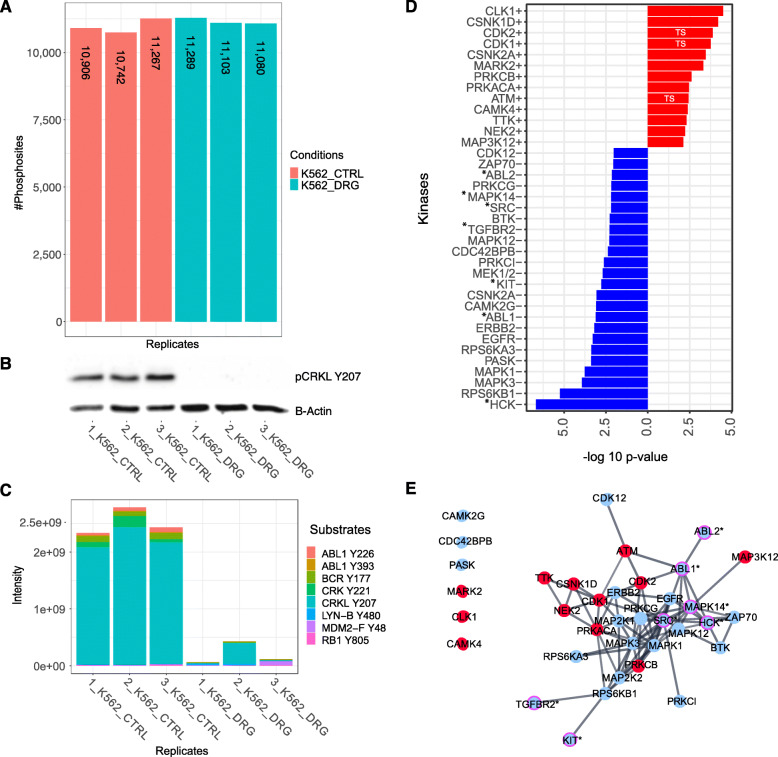
Fig. 3.
The phosphoproteome analysis of K562 perturbed with Nilotinib. A Barplot represents the number of quantified PS in every replicate before imputation for K562 exposed to control (CTRL, red) or 1′000 nM Nilotinib (DRG, green) conditions. (B, C) Inhibition of ABL1 substrates with most abundant inhibition of the reference site pCRKL Y207 as shown by WB and MS (light green). The original western blots can be found in the additional file 2. D KAEA waterfall plot showing overactive (red) and underactive kinases (blue) after exposure of K562 to Nilotinib. E STRING kinase-signaling network of significantly positive (red) and negative (blue) enriched kinases. The magenta edged kinases with asterisks (*) highlight experimentally validated targets of Nilotinib. TS: tumor suppressor

