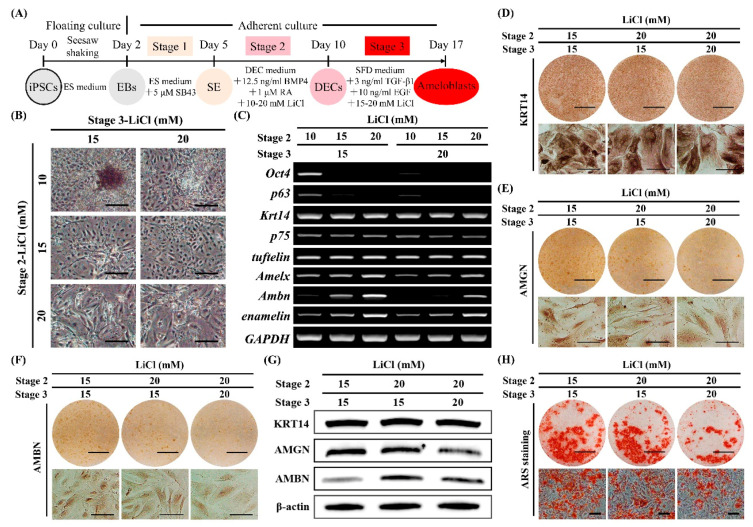
Figure 3.
Optimization of LiCl concentrations at stages 2 and 3 for ameloblast induction. (A) Diagram of ameloblast induction from Amelx-iPSCs. Different concentrations of LiCl were tested at stages 2 (10, 15, and 20 mM) and 3 (15 and 20 mM) to optimize the stage-specific concentrations for ameloblast induction. (B) Cell morphology after stage 3 induction (on day 17). Scale bars: 200 μm. (C) Gene expression as determined by semi-quantitative RT-PCR analysis after stage 3 (on day 17). Marker expression (stemness: Oct4; proliferative epithelium: p63; dental epithelial cells (DECs): Krt14, p75, and tuftelin; and ameloblasts: Amelx, Ambn, and enamelin). (D–H) Evaluation of ameloblast phenotypes, with higher expression of ameloblast marker genes after stage 3 (on day 17), as determined by immunocytochemistry for KRT14 (D), AMGN (E), and AMBN (F); Western blot (G); and Alizarin Red S (ARS) staining (H). Scale bars: 1 cm and 100 μm for upper and lower panels, respectively.

