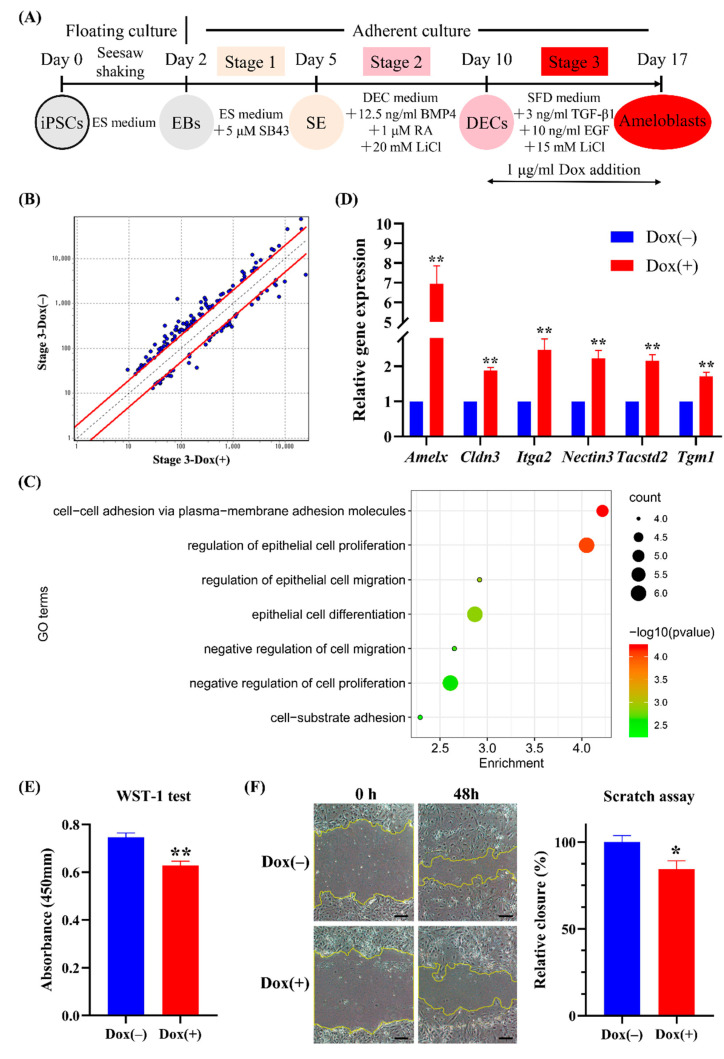
Figure 6.
Effects of transcriptional activation of Amelx in Amelx-iPSCs at stage 3 by microarray analysis. (A) Diagram of induction protocol. Using the established stepwise ameloblast induction from Amelx-iPSCs, 1 μg/mL doxycycline (Dox) was added to the induction medium during stage 3, and microarray analysis was performed after stage 3 (on day 17). (B) Scatter diagram of differentially expressed genes (DEGs) identified by microarray analysis. (C) Gene ontology (GO) terms associated with the upregulated DEGs. (D) Verification of six upregulated DEGs (Amelx, Cldn3, Itga2, Nectin3, Tacstd2, and Tgm1) by real-time RT-PCR. ** p < 0.01 (t-test; n = 3). (E) Cell proliferation measured by the WST-1 assay on day 17. ** p < 0.01 (t-test; n = 3). (F) Representative images and quantification of scratch assay for evaluation of cell migration. Scratch assay was performed on day 13 at stage 3. The cell migration was measured at 0 and 48 h after cell scraping. Scale bars: 200 μm. * p < 0.05 (t-test; n = 3).

