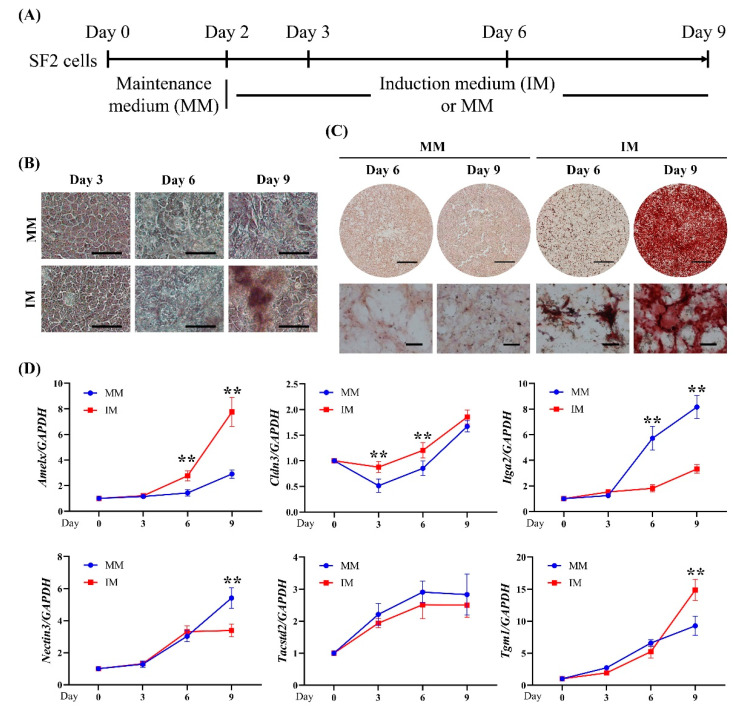
Figure 7.
Verification of the upregulated DEGs in a rat dental epithelial cell line (SF2 cells). (A) Diagram of SF2 cell induction toward ameloblasts. (B) Cell morphology at days 3, 6, and 9. Scale bar: 100 μm. (C) Alizarin Red S staining at days 6 and 9. Scale bars: 5 mm and 200 μm for upper and lower panels, respectively. (D) Expression pattern of the upregulated DEGs during ameloblast differentiation of SF2 cells as determined by real-time RT-PCR analysis. Significant differences (** p < 0.01: two-way ANOVA with Sidak’s test; n = 3) were evaluated with respect to the values between MM and IM at each time point.

