Figure 3.
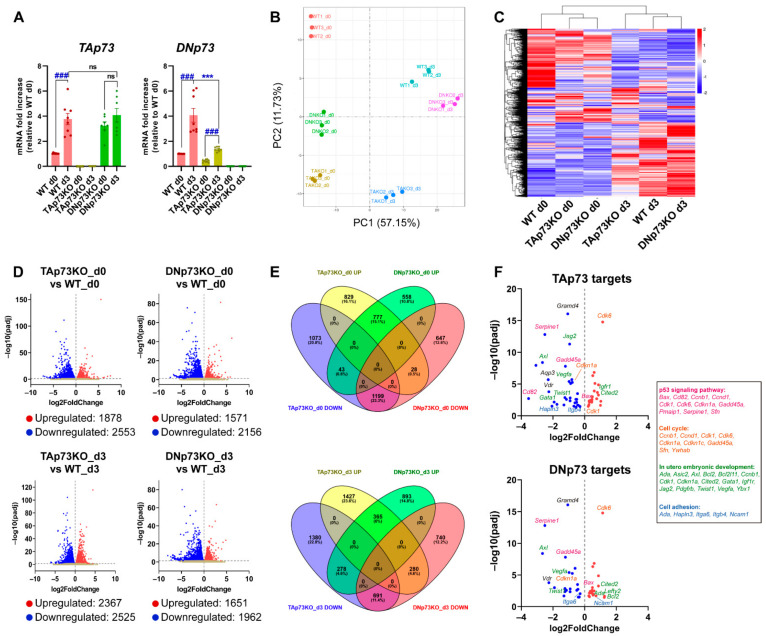
Elimination of the TA- or DN-p73 isoforms results in alteration of mESC transcriptional profiles with some genes showing isoform-specific deregulation, while others are affected by either isoform knockout. (A) Expression of p73-isoforms, analyzed by qRT-PCR, under differentiation-permissive conditions (after three days of EBs culture, d3) compared to stemness basal conditions (d0, S/L). At least, three independent experiments were performed. ***, ### p-value < 0.001. (B) Two-dimensional principal component analysis (2D PCA) score plot showed that samples clearly segregate from each other, demonstrating clear transcriptional differences among groups. (C) Hierarchical clustering analysis of expressed transcripts in the different cell lines under either stemness (d0) or differentiation-permissive conditions (d3). (D) Volcano plots of differentially expressed genes between E14-TAp73KO and E14-DNp73KO samples vs. E14-WT controls at the different time points analyzed. The estimated log2 Fold Change is plotted against log10 adjusted p-value (p-adj). Upregulated and downregulated genes are highlighted as red and blue dots, respectively. Genes that are not differentially expressed are represented as gray dots. (E) Venn Diagrams illustrating the relationship of up and down-differentially expressed transcripts in E14-TAp73KO and E14-DNp73KO samples compared to E14-WT controls at day 0 and day 3. The percentage of changed transcripts in each group is shown in parentheses. (F) Volcano plots showing differentially expressed genes (DEGs) between knockout cells and WT controls (S/L conditions) that were found to be common to a panel of validated p73 targets associated with p73 canonical and noncanonical functions. Genes associated to GO terms “p53 signaling pathway” (pink), “cell cycle” (orange), “in utero embryonic development” (green) and “cell adhesion” (blue) are indicated.

