Figure 4.
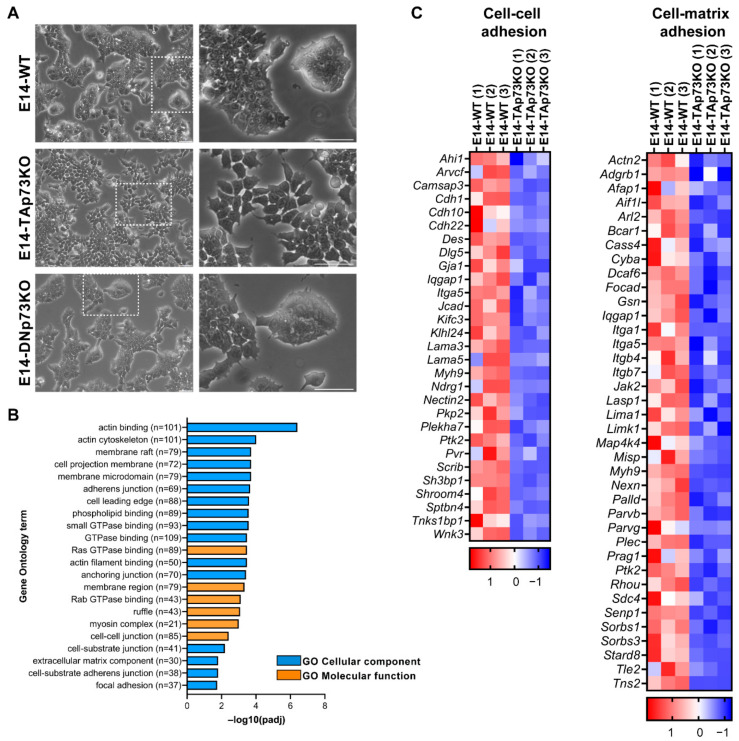
p73 regulates cell adhesion gene networks in mESC. (A) Representative images of the three cell lines when seeded under proliferating culture conditions (S/L). The insert represents a magnification from the indicated area (white square). Scale bar: 250 μm. (B) Gene Ontology (GO) analysis for downregulated genes in E14-TAp73KO samples compared to E14-WT controls. The number of genes for each term is indicated. (C) Heatmaps of down-regulated DEGs in E14-TAp73KO vs. E14-WT under stemness conditions. The cell-cell adhesion heatmap includes the DEGs in common among the GO categories “adherens junction”, “anchoring junction” and “cell-cell junction” from (B). Likewise, the cell-matrix adhesion heatmap contains the overlapping genes from the categories “cell-substrate junction” and “focal adhesion”. RNA-Seq expression Z-scores for each gene are plotted.

