Figure 7.
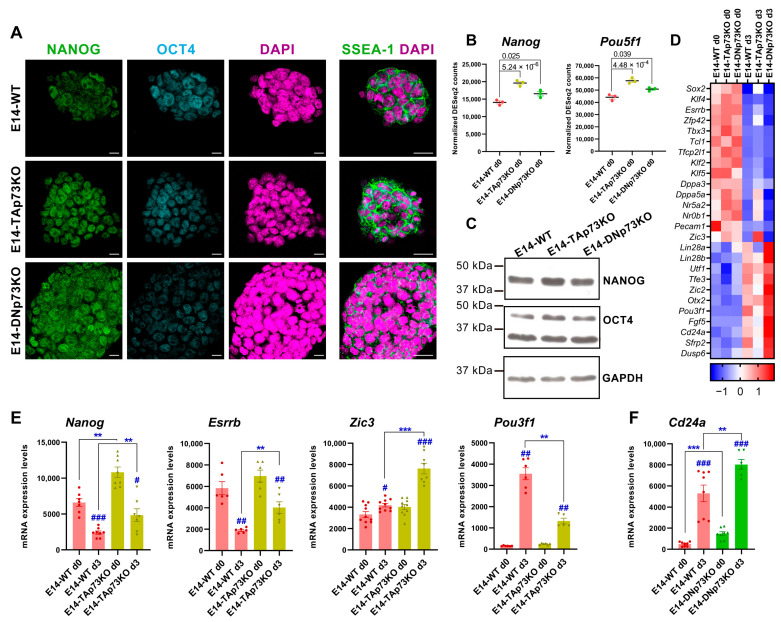
Lack of p73 isoforms predisposed naïve pluripotent mESC to transition into primed cells in an isoform-specific manner. (A) Confocal microscopy analysis of pluripotency markers NANOG (green), OCT4 (blue) and SSEA-1 (green). DAPI (purple) was used to visualize nuclei. Scale bars: 20 μm. (B) Expression plots showing normalized DEseq2 counts for Nanog and Pou5f1 from E14-WT and p73-isoform-specific KO samples under basal conditions (S/L, day 0). p-adj values are indicated. (C) Western blot analysis of NANOG and OCT4 protein levels in E14-WT and p73 isoform-specific KO cells. GADPH was used as loading control. (D) Heatmap visualization of RNA-Seq expression Z-scores for regulatory genes of core and naïve pluripotency, as well as markers of transition and primed pluripotency in E14-WT and p73 isoform-specific KO samples from day 0 and day 3. Average values for each condition are plotted. (E,F) Analysis of pluripotency markers by qRT-PCR in E14-TAp73KO (E) or E14-DNp73KO (F) cells. # p-value < 0.05, **, ## p-value < 0.01, ***, ### p-value < 0.001.

