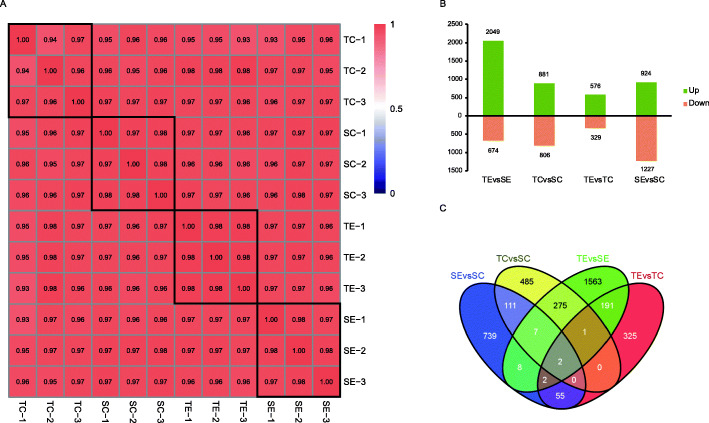
Fig. 2.
A Correlation pattern of each sample. Pearson correlation coefficients of samples within and between groups were calculated with the TPM of all genes in each sample. The black box represents the correlation of three replicates of the same sample. B Statistics on the number of DEGs in the four comparison groups. C Venn diagram of DEGs in different treatments of L. chinensis “LC18002” and “LC17041”. TE is the herbicide treated group of tolerant population, and SE is the herbicide treated group of sensitive population. TC is the control group of tolerant population, and SC is the control group of sensitive population

