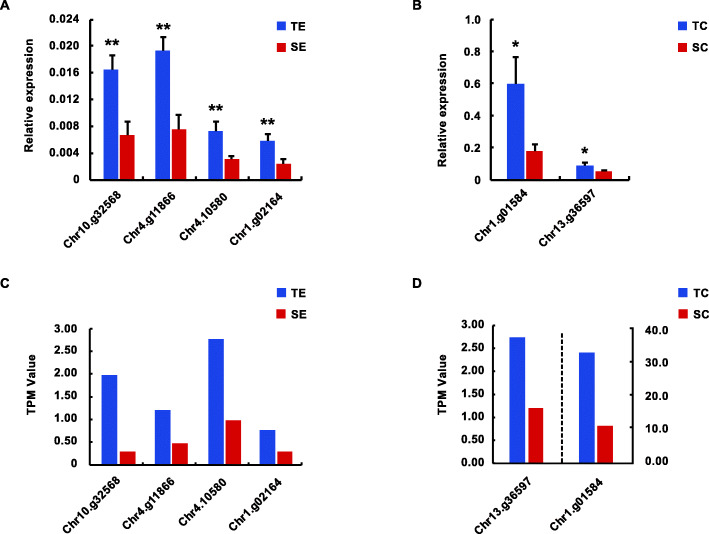
Fig. 6.
Verification of candidate genes’s expression between cyhalofop-butyl susceptible (LC17041) and resistant (LC18002) L. chinensis populations by qPCR. A Verification of the candidate genes selected in TE versus SE. The abscissa is the gene ID, and the ordinate is the relative expression values of the genes. TE is the herbicide treated group of tolerant population, and SE is the herbicide treated group of sensitive population. B Verification of the candidate genes selected in TC versus SC. The abscissa is the gene ID, and the ordinate is the relative expression values of the genes. TC is the control group of tolerant population, and SC is the control group of sensitive population. For all expression analyses, actin and 18 s RNA was used as reference. Error bars indicate mean + SD of biological triplicates (*P-value, t-test < 0.05; **P-value, t-test < 0.01). C TPM values of candidate genes between TE and SE. D TPM values of candidate genes between TC and SC. The genes to the left of the dotted line use the left Y-axis, and the genes to the right use the right Y-axis

