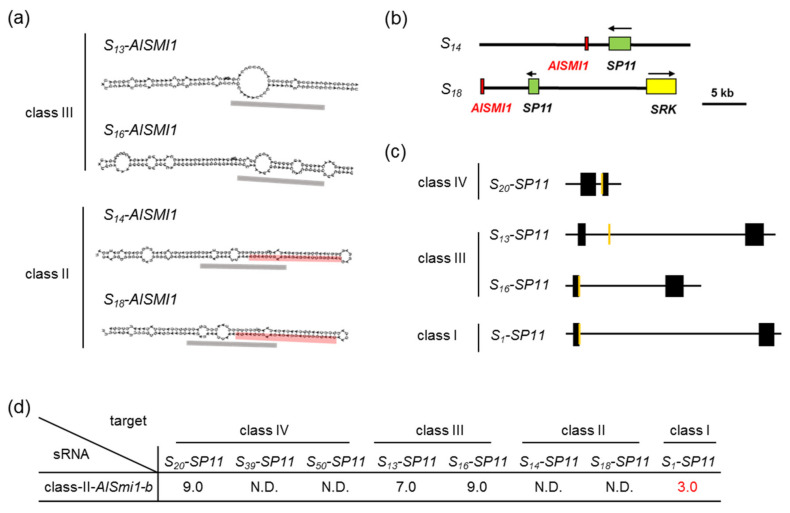
Figure 3.
Identification of sRNAs controlling the dominance–recessivity relationships: class II > class I. (a) Stem-loop structures of the S13, S16, S14, and S18 haplotypes of AlSMI1 predicted by RNAfold [20]. Black dashed boxes indicate 24-nt snRNAs corresponding to class-III and class-II AlSmi1-a. The predicted 24-nt mature AlSmi1-b is shown in red. (b) Schematic diagrams of the S locus in the S14 haplotype (KJ772406) and S18 haplotype (KJ772412). Green, yellow, and red boxes indicate SP11, SRK, and AlSMI1, respectively. (c) Schematic diagrams of the SP11 genomic regions of the S20, S13, S16, and S1 haplotypes. Black boxes indicate exon regions of SP11, orange boxes indicate the target regions homologous to AlSmi1-b. (d) Sequence similarity between AlSmi1-b and SP11. Numbers are the mispair scores between class-II AlSmi1-b and class-IV, class-III, class-II, and class-I S haplotypes of SP11. N.D., not detected. Mispair scores < 5.5 are shown in red.

