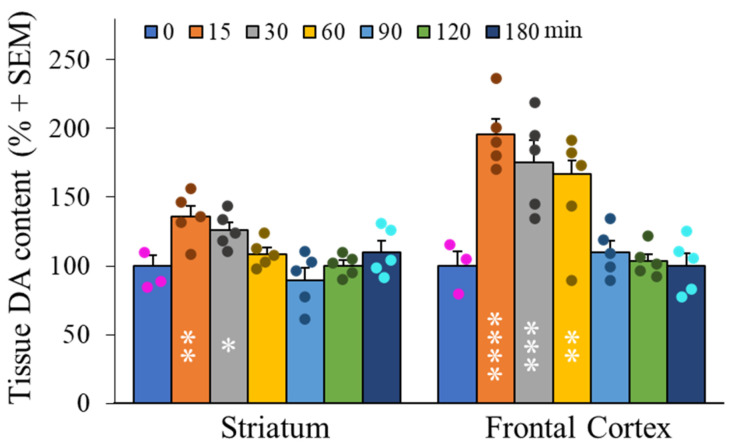
Figure 5.
Time course of dopamine contents in frontal cortex and striatum after administration of XA (1 mMol/kg, i.p). A. Histogram of time evolution of mean (+SEM) DA tissue content, as indicated. The increase in DA was maximal at 15–30 min after administration of XA, then decreased gradually to control levels after 90 min. The increase of DA is particularly high in the frontal cortex. Filled circles represent individual data point sets for each bar of the histogram accordingly. * p < 0.05; ** p < 0.01; *** p < 0.001; **** p < 0.0001; post ANOVA comparison with control animals using the uncorrected Fisher’s LSD statistical test.

