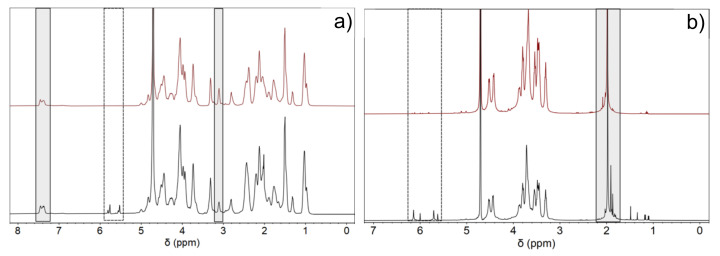
Figure 1.
NMR spectra of (a) Gel (—) and GelMA (—) and (b) HA (—) and HAMA (—). In (a) and (b), the dotted rectangles denote the presence of the methacryloyl peaks after successful modification. In (a), the grey rectangle at ca. 7.1–7.5 ppm denotes the phenylalanine peaks taken as reference, whereas that one drawn at 3.0–3.3 ppm corresponds to the decrease of lysine groups. In (b), the grey rectangle indicates the methyl groups of HA at ca. 2.0 ppm taken as reference and the appearance of methyl protons of methacrylate at ca. 1.9 ppm, respectively.

